What is SEOZoom?

SEOZoom is a platform that allows you to manage all your SEO and Content Marketing activities . More than 40 tools, easy to use and designed for all kinds of needs, indispensable for analyzing competitors, discovering new trends, creating perfect texts for blogs and social, fixing SEO mishaps and getting strategic data to always make the right choice.

Performance optimization, constant monitoring and suggestions to improve every aspect of your site: whether you are running a blog, an e-Commerce or a news portal, SEOZoom provides you with everything you need to get your SEO strategy off the ground. Thanks to the integration of the best content generator with AI for SEO, you can also optimize already published texts, develop new ideas, write social posts or product sheets quickly and easily, improving your editorial strategy and solving any critical issues with precision and effectiveness.

SEOZoom is constantly evolving to allow you to better cope with Google’s algorithm changes and new industry challenges. The philosophy behind the platform is simple: knowledge is power.

You can therefore always count on accurate data updated in real time, a customizable dashboard , and innovative tools that adapt to your needs, so you can better interpret the market and use effective solutions to optimize your work.

Who is SEOZoom intended for?

Agencies, SEO consultants, digital strategists and content creators can find in SEOZoom a valuable ally to manage every aspect to improve performance and positioning of their projects. It’s not just about keyword research and competitor analysis: SEOZoom offers tools to design and manage editorial plans, monitor article performance, identify the trending topics of the moment, get writing tips for any type of digital channel, and improve content in real time thanks to advanced SEO analysis.

Content marketers, copywriters, bloggers and journalists can leverage dedicated tools to write quality content optimized for both Google and the target audience. AI Writer and other generative tools assist you in creating original and effective text, while detailed analytics and reports help you focus on the most relevant topics, increase engagement, and improve customer communication.

SEOZoom is also a key resource for web agencies, because it reduces analysis time, suggests immediate solutions to optimize sites and pages, and allows you to manage multiple projects simultaneously, thus making the business scalable. Strategic use of the software helps you quickly find all the crucial information you need to closely track site performance and effectively assess the impact of your activities, and thanks to advanced reporting tools you can create customizable documents to share directly with clients.

SEOZoom, then, is not just an SEO suite, but a strategic ally for any online professional who wants to get real results.

How to sign up

In order to subscribe to SEOZoom you just have to fill in all of the fields in the dedicated page (at this address https://payments.seozoom.it/signup ): you will be requested to add your personal data – first and last name – and an email address where we will send the request for account validation. If you do not see the message among incoming emails, please check your SPAM folder.

At this stage you can also enter a coupon – if you have one – and access a free trial period.

How to buy a Plan

Once the registration is complete you can choose among four different types of subscription – Lite, Professional, Business, Corporate – and between monthly or annual subscription.

Therefore, in order to complete the procedure, you have to login, choose the subscription, add your personal (or business) data, and then select the payment method.

As regards the payment method, we offer three different options: PayPal, Credit Card and Bank Transfer.


How to deactivate your subscription

You do not really want to continue with your SEOZoom subscription? The process is quick and easy: just turn off the auto-renewal from the Invoicing section (https://sz2020.seozoom.it/user/billing)  by clicking on “Cancel automatic payments”.

On the other hand, if you pay by bank transfer, the subscription will just expire without the need for any further action.

If you have any questions, please contact us via the website chat: we are at your disposal.

How to customize your plan (ADD-ON)

You can expand the features provided in your “standard” plan without necessarily upgrading to the next plan. In fact, we have provided Add-on Packs to purchase additional features: currently you can purchase Projects, Keyword Packs, Editorial Plan Copywriter Accounts, Concurrent Accesses, but also increase SEO Spider crawl limits and enable integration with Looker Studio (only for Business and Corporate plans).

To increase the features provided in your plan access the UPGRADE -> ADD ON at the bottom of the side menu.

Home Dashboard

After logging into the suite, SEOZoom greets you with a dashboard full of controls and features, allowing you to keep track of the level of use of the resources provided by your subscription and already have some useful insights into the projects you create.

Specifically, in the top bar you can view the list of favorite keywords (the keywords you encounter during your analyses and want to save for possible future use or insights), change the reference database (and thus whether to set the analyses on Google UK or on the foreign versions of the search engine that are available), check the latest events related to the saved projects, and browse among the projects themselves.

Events, in particular, are useful for keeping an immediate eye on the variations (positive or negative) of the keywords you monitor in a project: in practice, SEOZoom notifies you that one of the keywords you have indicated as a priority for your strategy has just entered (or has just left) the TOP10 on Google, and shows you the detail of the variation and the main search data of the keyword itself.

A quick aside about favorite keywords: adding to this “notepad” is one of three options you have for saving keywords. In fact, in each and every keyword table you find in SEOZoom, you can click on the + button to automatically add the keyword to a project, to a specific keyword research, or, indeed, to your favorite keywords cart. You can set your preferred destination by clicking on the little arrows icon at the top of the left side menu and change the default insertion mode if you need to.

Moving to the middle part of the page, you can customize this home screen by choosing tools, features, and charts that you use most often and are most useful for your activities.

Just click on the label that appears on the right to open the customization menu and configure SEOZoom around your needs. You can choose which widgets to display in the dashboard from the ones available and remove the ones you need the least, so you can compose the screen in the way you really think best suits your way of working.

For example, you can add Domain Trending or Keyword Distribution charts, but also insert widgets that allow you to immediately use certain features such as Keyword Infinity, Analyze Keyword List or SERP Comparator.

Small note: you can insert some widgets multiple times, especially those related to projects, because this way you can immediately keep tabs on multiple sites you have in your project or projects located in other international databases (even while operating on your preferred DB).

In addition, you can choose your preferred sorting of widgets, simply moving them through the drag-and-drop system and removing those you find less useful by clicking on the red button with the X.

In the “Quick Links” field, on the other hand, you can configure quick links to sections or features within Projects, such as Keyword Studio, Page Performance, or Spider Scan Details. To customize the links you must first select the project, and you can set up these links for each of your projects in SEOZoom.

Just remember to save your changes once completed!

Creating a project

Creating a new project is the best means of knowing all the information regarding a website and viewing the most up-to-date statistics about its traffic and returns.

From this section you have the ability to monitor keywords, thanks to the tracking feature that indeed keeps track of improvements or droppings in ranking, but also spy on the competition and get important information about the status of the website.

To proceed in creating a project just click on the + button in the “SEO Projects” section of the left column, or on the + button that appears in the Projects menu in the top bar, or even on the dedicated button you find when analyzing any domain.

There are five steps to correctly set up the new project: let’s look at them in detail.

After clicking on New Project, a pop-up appears asking you to enter basic details, namely the name and address of the website: click on Save to proceed.

To continue with the configuration, click on “Set up Project” in the window that appears immediately after.

This will now open the section that allows you to add a list of Keywords to monitor, in which you can enter all the keywords that you think are important for your site and your strategy.

You can add keywords using the search function, the Add from list button, or the import tool (from .csv file or Google Search Console).

From here you also have another option, which is to use SEOZoom as a rank tracker to monitor the ranking of the keywords you are interested in on all international versions of Google. From Monitoring Settings, in fact, you can set the Google extension on which you intend to focus the analysis and its language, thus obtaining ranking information on the keywords you enter (but not the exact search volumes, which are only available for SEOZoom’s international databases).

Still in this area, then, you can also set up the monitoring of a keyword on a local basis, which is useful for queries strongly influenced by the user’s location: in fact, by default, SEOZoom analyzes SERPs by setting UK as the location, but in some cases you may need a more precise geolocation to really find out how your site and pages perform compared to competitors in the area.

The next step is about adding and selecting competitors in SERPs that you have personally identified or that have been recognized by SEOZoom: in this way, you will be able to access the project’s competitor section and have data tailored to your interests and needs. You can also extend the list of competitors by entering different domains in the search bar.

In the next tab you have the option to enter your brand name, people related to it, and specific products, information that SEOZoom will use to better monitor and verify your brand’s presence online by analyzing branded placements and proceeding with accurate branded link crawling.

To add an entry, simply type in the term and then “enter” with your keyboard so that a pillow tag will appear: you can fill in each field with up to ten items.

Having an idea of your brand’s presence on the web is a key aspect of an accurate marketing campaign, and SEOZoom helps you track brands, people or products related to a specific brand.

In the Users section, you can also provide access to one of your collaborators or external clients: this way, the user will be able to monitor data with the view-only function, for the individual project for which they are enabled.

To proceed, simply enter the person’s name and email and then click on Create User: the user will receive an email with instructions for accessing the suite and the project (i.e., from the link https://sz2020.seozoom.it/login ).

In the last step, you have the opportunity to connect your project to the tools provided by Google. This way you can monitor your work more comprehensively, integrating data with data provided by Google Analytics, Google Search Console and Google Looker Studio. To make the connection, just click on Connect and enter your account information.
Google API integration is optional (not mandatory), so if you prefer, you can skip this step and save the project.

As for Looker Studio, the integration is available only for the Business and Corporate plans, is activated through the add-on menu and has a monthly cost. By proceeding with the purchase you will be able to create charts and reports in Looker Studio using SEOZoom data and metrics. Specifically, when you first log in you’ll need to retrieve a token that allows the Looker Studio connector to “communicate” with SEOZoom and derive the required data; in addition, you’ll also find a handy file with a list of ready-made connectors, created to simplify and speed up your work with ready-made templates that can be copied into a single Looker Studio report

Other optional features include the ability to install the SEOZoom WordPress plugin, which allows you to optimize content directly from your WordPress panel.
[Please note: at the moment, this feature is only available to users who activated the account before 2023, as the new and improved version of the plugin is under development].

Perfect: you have set up your project correctly, now all you have to do is climb the SERPs!

Your Projects

The “Your Projects” area contains all the projects entered within your account: from here you can monitor all the sites quickly and easily, but also access the Bin to permanently remove obsolete projects or choose how to view the list.

The sections of the project

In the previous chapter we saw the steps to follow in order to add a new project in SEOZoom. In this part of the guide we are going to explore the “Your Projects” section and analyze all the items in the submenu that precisely pertain to one of your projects.

First of all, in the “Your Projects” summary screen -> https://sz2020.seozoom.it/projects  you can observe the following data:

  • Date and time of last update.
  • Total MONITORED KEYWORDS for the individual Project.
  • KEY UP: the number of monitored keywords that gained positive variations since the previous scan.
  • KEY DOWN: the number of monitored keywords that gained negative variations since the previous scan.
  • KEY STABLE: all keywords that have remained stable since the last scan and have not changed position within Google’s organic results.
  • TRAFFIC: measures the value of site traffic based on the monitored keywords.
  • MONTHLY TREND: indicates the monthly traffic trend of the monitored keywords.
  • WEEKLY TREND: indicates the weekly traffic trend of the monitored keywords.

From the buttons at the bottom of the box, it is possible to view the Project, directly access its modification area, or delete the project.

Then by selecting an individual project, you can notice a menu that takes you to the different analyses you can perform:

  • Project Overview: the main dashboard, from which you have access to the first valuable information about the Project.
  • SEO: the section from which to analyze the OnPage optimization, aany technical factors and work checklist.
  • Keywords: to analyze keywords in detail, thanks to the many subsections.
  • Pages: to see keyword rankings for individual URLs and analyze the Pages Performance.
  • Competitors: to spy on the performance of your competitors and find out the differences in positioning.
  • Backlinks: the section from which you will be able to access our Link Monitor.
  • Analytics: if you have connected your Analytics account, in this section you can analyze data directly on SEOZoom with simplified views.
  • Notepad: where you can create and find your various Project Notes.
  • Edit: from which you can change the Project settings.

Let’s take a look now, in detail, at the various internal features of the project.

Project Overview

In the first menu item (Project Overview) you have access to a whole range of data dedicated to the domain you are monitoring.

Within the first dashboard you find the estimated traffic of the domain and that of the keywords you have decided to monitor in the project, then a series of indexes inherent to the domain’s performance, such as Zoom Authority, Zoom Trust, Zoom Stability and Zoom Opportunity (you can find their definitions in Glossary -> https://guide.seozoom.com/glossary/ )

This is followed by three boxes from where the status of the monitored keywords is immediately visible: those that have risen, those that are dropping, and those that are stable.

Synthetically, then, at the top of the overview are:

  • The estimated traffic.
  • The Zoom Authority.
  • The Zoom Trust.
  • The Zoom Stability.
  • The Zoom Opportunity.
  • The number of monitored Keywords increased from previous scan.
  • The number of monitored Keywords decreased from previous scan.
  • The number of monitored Keywords stable compared to previous scan.

In the second part, the dashboard presents other useful information for your strategy.

  • The first box shows summary data from the SEO Checklist, the tool that allows you to keep track of a number of SEO elements and best practices, with an actual checklist and operational optimization tips.
  • SEO Optimization: the more “technical” tool, which analyzes the domain and gives you information about errors or warnings related to site elements.
  • Quarterly Plan: the tool that helps you plan site activities based on keywords that have increasing search trends in the following months.
  • Improve Content: the tool that helps you analyze the site’s Pages based on their performance and gives you tips on how to improve them.
  • Watch out for Competitors: a quick check on Competitor trends, so you always have a useful overview info at your fingertips about the context in which your site operates.

Below this dashboard you have a few important charts:

  • The first is Monitored Keywords Ranking, with the estimated traffic trends for Monitored Keywords (and therefore the ones entered to Project), which immediately gives you an idea of the ranking in SERPs (TOP10 in green, over in red). The graph updates every 24 hours and shows in the upper right hand corner the date and time of the last update.
  • Project Keywords Trend reports the graphical summary of the most important changes in the keywords you have chosen to monitor, also reporting the date of the last update.
  • Domain Trend is a graph that updates every 7 days and shows an overall view of the website’s performance, from which you can check the overall performance of the website and also keep track of Google’s algorithmic updates, marked with the Google “G” icon right at the date the update was launched. You can also add notes, to keep track of useful information for your strategy.
  • Keywords Distribution quickly shows you how and how often your site’s keywords are ranked within the first five Google pages.
  • This is followed below by the Zoom Authority trend graph, which visually shows how this metric has changed over time, and the Traffic Prediction graph: the latter shows the “expected traffic” that may reach your site over the next 12 months, which is an estimate based on current placement data and the seasonality of individual months, assuming that for the next 12 months the estimated data remains unchanged.

Continuing the navigation of the page, further down you will find some tables inherent to the Pages of the project site and its monitored keyword, namely:

  • Pages that are gaining traffic: i.e., Pages that are ranking well in SERPs and have gained placement in TOP10 since the previous scan.
  • Pages that are losing traffic: i.e., mirroring the previous box, Pages that are declining and have lost placements in TOP10.
  • Pages bringing the most traffic: the “Best Pages” of the Project site, those with more keywords in TOP10, which bring good traffic to the domain.
  • Ideas for new articles: helps you identify new keywords on which it might be interesting to write new content, with indication about the main Intent currently identified (and rewarded) by Google. On the practical side, SEOZoom shows you a list of keywords for which Competitors are ranked but the Project domain is not in TOP50.The screen ends with a quick view of the Project keywords, and thanks to the two tables we can immediately identify the rising monitored keywords and the dropping monitored keywords.

In all tables, at the end of each row, you will find the hamburger menu that allows you to perform specific in-depth actions based on the type of “object” being analyzed. You can read more in the glossary (Hamburger Menu Actions).

Keywords

By browsing the Keywords submenu you can delve into the main aspects related to the analysis of the keywords on which the site competes, and in particular you can check the trend of the monitored keywords, find out which keywords are the best and potential ones, and then again know the ones going up, down, those entering or leaving the TOP10, up to viewing all the keywords for which the project domain is positioned.

Monitored Keywords

The first section of the menu allows you to delve into the performance of the monitored keywords, which are precisely those that you have decided to include in the list that SZ provides you to track performance more accurately.

In the left part of the screen you can consult the table with all the keywords you have added, for which the main information and values are shown (estimated search volume, position in SERP, variation from previous scan and SEO score from the last analysis), with the possibility of extending the analysis in detail by clicking on the hamburger menu (which opens the “keyword actions”).

On the right side you can check the performance of the individual keyword selected in SERP and all the main changes in organic ranking over time, with the possibility to set a custom date range as well. On the other hand, by clicking on the “SERP feature” TAB you can view the composition of Google’s SERP for that keyword, with a preview of the results placed in TOP10 with their snippets and a description of any additional features present, such as featured snippets.

Lastly, the last box on the right lists the sites positioned in the first 5 pages of Google for that keyword and reports the change in ranking since the previous scan; furthermore, clicking on a result automatically adds the page to the SERP Trend graph to allow you to make a visual comparison between the performance of the various sites.

To refine your analysis, you can use the different filters available and then select specific groups of monitored keywords to study; in particular, you can filter keywords according to their performance, according to the tags you have set, or according to the latest time changes.

Then, by clicking on the “Compare with Competitors” tab, you can analyze the performance of the monitored keywords of your project site with the domains you have identified as organic competitors: for each keyword, SEOZoom shows you the search volume, the position of the project site and its URL, and, on the same line, information about the different competitor sites, to perform quick checks and strategic evaluations.

Keyword Studio

Keyword Studio is the heart of the Project pertaining to everything that is keyword analysis!

From here start different analysis paths, different visualizations and tables that will keep you up-to-date on the Keyword performance of the Project site.

The first table available to you is the Ranked keywords table, that is, the top keywords placed in the top ten positions on Google.

The next tabs allow you to delve into the keywords divided into Traffic Increases and Drops (i.e., the keywords that have entered or left the TOP10), which is useful to find out which keywords are gaining positions and which are losing them. The box on the right summarizes for you at a glance the overall situation, showing the total number of keywords going up or down and the corresponding change in traffic generated by these movements; by activating SERP View, then, you have the possibility to check the composition of the most recent SERP and make a quick comparison with competitors.

Next is the Potential tab, which groups keywords positioned from the 11th to the 30th position: this section contains information on all those keywords positioned on the second and third page of Google, which with effective optimization activity you could bring to TOP10 to get more organic traffic. This list is very interesting for your strategy, because it makes you immediately discover keywords with good growth potential for the Project site and allows you to identify all the pages (also filtering the results by URL) that just need a little “push” to climb more positions, such as a content-improving intervention or possibly an OffPage SEO activity.

In the Featured Snippets table you find the keywords in position Zero – i.e., the keywords that have gained a featured snippet in SERP – and you also preview the snippet chosen by Google.

SERP Features is the section that shows you the Keywords positioned in a SERP in which there is at least one Google feature, with indication of the type and possibility to filter so to analyze the type of feature that enriches the results page.

In the Branded Keywords table you can check which keywords are related to your Brand or your brand’s products (based on the information you entered in the project settings).

And, last but not least, All Keywords lists you precisely all the keywords placed for the Project domain: within this last section you can then discover all the keywords for which the project domain is present in the first five pages of Google, thus including the words that you chose not to monitor or that you did not consider when creating the project itself. Within the screen you can filter keywords by positions and thus perform a more in-depth analysis of the project, or use the time filters to check keywords detected in three different crucial moments (yesterday – today – last week).

In each section, the keywords list table reports a range of data and information useful for analyzing the keyword and making strategic assessments, which can then be deepened with the actions included in the hamburger menu. Specifically, the columns allow you to check:

  • Pos: the Position in SERP.
  • Var: the change in ranking from previous scan.
  • Volume: the average volume of the Keyword.
  • Estimated Traffic: the traffic estimate calculated by SEOZoom for the specific keyword.
  • Intent: the type of intent (Informational, Navigational, Commercial, Transactional) identified for the keyword.
  • Features: indicates the presence of features in SERP and specifies their type(Frequently Asked Questions Box, YouTube Video List, Photo Carousels, etc.).
  • Average CPC: the average cost per click.
  • URL: the Page positioned for the Keyword.
  • Seasonality: search volume graph on a monthly basis, which allows you to find out at a glance if the Keyword is subject to a seasonal kind of variation.
  • KD: Keyword Difficulty.
  • KO: Keyword Opportunity.

In Keyword Studio you can also group URLs and filter the tables by page by simply dragging the URL column to the top section of the table.

Quarterly Plan

The Quarterly Plan tool allows you to perform an analysis on the upcoming quarter, to find out which keywords will tend to have higher relevance and then prepare an appropriate optimization strategy to improve your presence in SERPs.

Thanks to the filter in the upper right corner, you can select keywords based on a specific range of search volume, so you can work more directly and strategically on a smaller group of keywords and pages.

Also, to filter the table by pages (and not on individual keywords) you can drag the URL column to the top section of the table, thus setting up a view by URL groups.

The table presents you with crucial data for each keyword, specifically the average monthly search volume, expected search volume in the next three months, seasonality chart, Intent type, active Features in SERP, KD and KO levels, while the hamburger menu allows you to deepen your study with Keyword Actions and URL Actions.

Content Gap

In the content gap analysis tool SEOZoom offers you an analysis on the selected keywords by analyzing the main competitors dealing with similar topics as the Project site.

For each keyword, in the table you will find indication of intent type, KD and KO values, CPC value and estimated search volume, and by clicking on the hamburger menu you can further deepen the analysis with various “keyword actions”.

The tool can help you find ideas for content on which you have not yet built any pages or posts, but it may also show you keywords for which you already created content, but that still have not ranked well in SERPs. In that case, if you click on a keyword, you will find in the table on the right the existing pages of your website that deal with topics related to that keyword, to which it might be profitable to devote an optimization effort.

On the top right side there is also a keyword search box, that you can use to check whether you have actually already written content for the keyword you are interested in.

Seasonal Keywords

The “Seasonal Keywords” section presents a comprehensive report on the seasonal volumes of the keywords for which the project website is positioned. From the horizontal selector at the top you can choose the month you want to analyze: after clicking, the central table will list all the keywords that have an increase of at least 0.25% over the average annual volume in that specific month.

In the top dashboard there are four aggregate values:

  • Potential traffic of the month: the estimated traffic assuming that the keywords listed in the table (and not on the first page on Google) will reach the fifth position in SERP.
  • Current traffic: the current estimated traffic, based on the seasonal keywords already ranked in TOP10.
  • Results obtained: a horizontal bar showing at a glance the current percentage of seasonal keywords traffic to the project site compared to the total potential they could achieve.
  • Increment: a selector that allows you, by increasing or decreasing the value on the scale, to filter out keywords with increasing seasonal variation.

The first column shows the keywords; this is followed by the position column, the ranking variation from previous scan, the ranking URL, the average monthly volume, and the column showing the search volume for the keyword in the single month analyzed. The Seasonal Increase column highlights the estimated monthly volume increase of the keyword, while the seasonality graph shows the trend throughout the year. Other useful information for your strategy is also shown for each keyword, such as the search intent, whether there are any features in SERP, and KD and KO values, with the hamburger menu leading you to Keyword Actions and URL Actions for further types of analysis.

In this section, too, you can group URLs together to have the table filtered by pages: simply drag the column to the top section of the table.

Remember that the features in the “Seasonal Keywords” section help you get an overview of the website’s performance and potential. Use the information to plan page revisions, to develop your link building strategy, or to define new content to be created.

Long Tail Keywords

With this tool you can delve into the long-tail keywords for which your website is ranked, with all the basic information to analyze the keyword from different strategic aspects and launch “keyword actions” and “URL actions” (available from the hamburger menu).

Use the sidebar to set the filter based on search volume and develop a winning strategy on high-potential terms. In this section, as well, you can set the table view by page and not by individual keyword: just drag the URL column to the top section of the table.

Distribution

Within this section you can analyze the distribution of your Project site’s keywords, that is, how and how often they are ranked within the first five Google pages. Here is an example screenshot:

The first bar graph shows the values by number of keywords in the search engine pages: the first page results are detailed and indicate precisely the keywords present between the first and third position, those between the fourth and sixth position and, lastly, the keywords present between the seventh and tenth position. In other cases, however, the bars unite all the keywords present on the referring Google page.

The pie chart, on the other hand, shows the distribution of keywords in terms of percentage. You can also use the timeline to select a date, so you can check how the distribution has changed over time.

The chart below allows you to focus on the historical distribution of keywords by following the trend of the lines, which have different colors based on the Google page they refer to. Again, you can select any date range you like over the past two years, where the data is present.

At the bottom of the page we have the data available in tabular form, marked by the last 7 weekly project updates.

Niche Keywords

In this section SEOZoom shows the list of all the Sectors inherent to the project site “identified” by Google, specifying for each one the total of related keywords placed.

In the dashboard at the top there are four boxes, from which you can check the information related to the currently selected individual sector/category:

  • Overall Ranking: the site’s position in the Overall Ranking for that sector (for the individual sector/category selected).
  • TZA: the Topical Zoom Authority related to the sector (for the individual sector/category selected).
  • Search Volume: the total search volume of your site’s keywords placed in that industry (for the individual industry/category selected).
  • Keywords: the total number of keywords on your site that are placed in that industry (for the individual industry/category selected).

You can browse the left menu and check how many and which keywords belong to the different sectors, and how they are positioned; you can also delve into the topic of Sectors from the dedicated tool -> Niche Investigation -> https://sz2020.seozoom.it/keyword-research/keyword-niche .

In the right table we find the analysis of keywords by Sector, with columns useful for the analysis:

  • Pos: the SERP position of the site under analysis for the indicated keyword.
  • Volume: the average search volume.
  • Intent: the type of prioritized search intent.
  • Features: the features present in SERP.
  • Average CPC: the average cost per click.
  • URL: the Page of the site positioned for the selected keyword.
  • Seasonality: graph of search volume on a monthly basis, which allows you to find out at a glance if the keyword is subject to a seasonal type of variation.
  • KD: Keyword Difficulty.
  • KO: Keyword Opportunity.

At the end of each row, then, you can find the hamburger menu from which you can launch a series of more in-depth analyses on the keyword or page.

Social Opportunities

“Social Opportunities” is a tool designed to help you identify those keywords specific to your industry that not only drive traffic to your site, but are also valuable to your social media presence. More specifically, it allows you to discover which keywords are generating Top10 ranked results in Google SERPs from social platforms such as Facebook, Instagram, YouTube or Pinterest, in addition to traditional sites.

“Opportunities” are identified through a competitor analysis of the project site you are working on: this can be fully automatic (if you have not added any competitors in the project settings) or somewhat guided (if you have manually entered known competitors, also shown in the table above). In the latter case, the data will be much more accurate and relevant to the scope of your site’s activity, reducing the possibility of finding “false positives” (such as only partial competitors, which therefore also lead to the inclusion of off-target keywords for your interests).

In the general table of the tool you will see a range of useful information such as the social platform or UGC that has a top 10 result for the keyword, global and specific traffic volume for the social result, search intent identified by Google, seasonality of searches, and Keyword Opportunity and Keyword Difficulty values. Using the left column, on the other hand, you can filter the analysis by the type of social media or UGC site you are most interested in, so you can focus on a specific channel or content type.

This information gives you valuable insights for a more effective multichannel content strategy: thanks to “Social Opportunities,” you have the opportunity to expand your output by leveraging social platforms that Google considers relevant to your keywords. This will allow you to diversify your content, focusing on multimedia formats that can increase your visibility and intercept a wider audience. At the same time, you can strengthen your presence on keywords and increase your organic visibility by investing in the creation of multimedia as well as text content geared toward the social media favored by Google.

Google FAQ

Google FAQ allows you to see all the questions users ask about the content your website covers.

To be precise, it lists all the questions that appear in the “People Also Ask” box of Google SERPs in correlation with each keyword for which your site is ranked in the top 10.

This way you can discover common issues and frequently asked questions from users, so you have a detailed overview of their needs that you can take into account to enrich and improve your content.
In fact, thanks to Google FAQs, you can see right away whether your content meets the real needs of users doing Google searches. With this information, you can optimize your web pages to make them of higher quality and more relevant to people.This tool helps you structure your articles perfectly, answering users’ questions and concerns directly and increasing the likelihood of providing comprehensive and relevant answers to users’ searches.

SEO

From the SEO section you can carry out different analyses on the optimization of your Project, both OnPage and technical; in particular, from here you can analyze the OnPage optimization of the site, access the checklist, which presents a list of actions and verifications to guide you in the development of the management of an SEO project, as well as launch the SEO Spider analysis, so that you can delve into the state of the domain on a technical level, and the Page Speed test, based on data from Google tools.

OnPage SEO

The OnPage SEO section offers tools and analysis to support the optimization of all elements within the web pages of your site.

It is divided into 4 tabs: All keywords, Configured keywords, Keywords with issues, Keywords to set up, and allows you to do analysis on different aspects.

So in this section you can figure out what mistakes, if any, have been made and get an evaluation on a percentage basis that is mainly based on the response to three OnPage factors:

  • Title
  • Description
  • Search Intent

The analysis is done based on an already positioned key or by associating a keyword among the monitored ones with the page you intend to optimize.

Here is an example screenshot:

In the area on the left you can vary the focus of keyword analysis, with 4 possible groups:

  • All keywords: all monitored keywords and any associated or to-be-associated URLs.
  • Configured keywords: all keywords for which you have already indicated the web page you would like to place.
  • Keyword with issues: the tool shows in the table the keywords that currently rank in SERP with a different page than the one you have configured in this section.
  • Keyword to set up: the tool shows in the table the keywords that you have not yet associated with a specific URL.

It is also possible that the tool recommends you a different URL than the one you have matched: if so, you can consider changing it if it is useful/if you are interested in working on its optimization.

By selecting a key from the table (if necessary, you can also change the analysis URL), SEOZoom offers on the right a dashboard with different data and scores on the level of optimization.

From the tabs, different levels of insights are available:

  • Tips: suggestions related to SEO optimization best practices for the actual body of content.
  • Page Analysis: a technical summary of the page under review, showing indications of the tags used (title and meta description), headings (list of all H1, H2, H3, etc. present) and formatting (particularly terms emphasized in italics or bold in the text), as well as links and images present in the entire URL content.
  • Keywords: with indications of the keywords placed in SERPs.
  • Keywords in the text: the keywords with search volumes, relevant to the search intent related to the main kw with which the URL is associated, that SEOZoom actually found in the text of the page.

Actions from the hamburger menu:

For each row, you can also initiate additional Actions from the table, either on the Keyword or the URL. Specifically, you can check the Latest SERP, launch the specific Analysis and Search Intent Analysis for the Keyword, find similar Keywords and start the editorial assistant to write a new content, and – furthermore – browse the URL, analyze it in detail, check the Search Intent of the URL and add the address to the list of monitored URLs.

SEO Checklist

The SEO Checklist section presents a list of actions and checks to guide you through the development of an SEO project, keeping note of everything you have already done and what remains pending.

The SEO work has been categorized starting with all the basic checks you need to do on any website, such as setting up Google Search Console, Google Analytics, and other basic prerequisites to get off on the right foot.

For each element of the SEO Checklist there are two buttons: clicking on “Info” opens a window explaining the relevant topic, while the second button varies depending on the type of activity, and in some cases it might suggest an action on an external page, such as to configure Google Analytics, or refer to the specific section of SEOZoom to take direct action on the point under analysis.

SEO Spider (Project)

The spider is a tool that allows you to deeply analyze the structure of your site by scanning it for internal links.

It is a complex tool because it offers technical data that needs to be interpreted as best as possible, but it is also the means to take a step forward and really be able to improve your site.

In fact, SEOZoom’s SEO Spider shows how a website is viewed by the Google’s spider, highlighting anomalies and all possible errors in the code or in the use of TAGs that important for the SEO.

The “ERRORS” and “WARNING” filters group together the various issues you need to be aware of and should take action on, and allow you to simplify the viewing of the screens.

From the SEO Spider you can analyze the crawl with individual errors/warnings:

Or analyze the site tree (Crawl Tree):

From this section you can only launch the crawl of only the site you have entered as project; to examine a different domain, you can activate the tool from the left side menu and set up the analysis you are interested in (click here for more information on how to use the spider and the information it reports).

SEO Page Speed

The Page Speed section allows you to check the behavior of your site against some of the main parameters that refer to technical performance, based on static monitoring on a weekly basis of the values detected by the Google Lighthouse tool. To be precise, SEOZoom crawls your site through our servers located in Italy, applying the rules that Google provides to evaluate performance and used, precisely, to compose the Lighthouse report, which can be found in the developer tools section of Google Chrome.

In particular, within the Performance section you can perform an analysis on the speed of the website’s Home Page, with all the information to improve the responsiveness of the online project thanks to an evaluation on a 100 basis.

After clicking on “Page Speed” you will be presented with a dashboard that shows a preview of the Project site on the left and, immediately below, allows you to add more template pages to analyze. On the right, however, a graph appears showing the site’s performance over time, with various tabs that allow you to deepen the analysis.

Also on the right, immediately below the graph, SEOZoom provides you with a more in-depth PageSpeed analysis on some crucial performance aspects, available for both desktop and mobile versions of the site.

Here is an example screenshot:

By browsing the submenu you can get more information, statistics and optimization tips for speed and performance of your website, with particular reference to the values of the Core Web Vitals, technical parameters that Google considers in the overall Page Experience as a ranking factor to determine page rankings.

You can also ask SEOZoom to monitor up to five page types: just click on “Add template Page” and indicate the page type and URL on which to run speed and usability tests.

Page template (type) means, for example:

  • Category page
  • TAG page
  • Single product page
  • Article page

In this way, you can analyze the speed of each type of page template on the website; after you load the page, the engine scans it as soon as possible and stores the performance trend over time.

Pages

The Pages section allows you to analyze, monitor, and optimize the performance of the web pages of the project site through many useful sections: let’s take a look at them together!

Pages Performance

The first section gives you an overview of both the Performance and Crawl Budget usage, based on a set of predetermined traffic ranges. The Crawl Budget value represents an estimate made by SEOZoom of the resources Google has to devote in order to crawl these pages: the figure can help you quickly figure out which sections of the website are taking up the most resources and which are bringing in a higher estimated volume of traffic.

The following values are highlighted in the top three boxes:

  • Wasted crawl budget: how many and what percentage of the total are very low performing pages, which are therefore wasting the site’s crawl budget
  • Improve Your Pages: a preview of how much content is “easy to optimize” according to SEOZoom, namely those resources that already have a good potential of keywords positioned on the second and third Google page, and the percentage of traffic increase that the actual improvements could bring (-> by clicking on Improve Your Pages you can directly access the dedicated view).
  • Attainable Goal: A summary of the results you can achieve by optimizing your content, and in particular the volume of potential visits you could get by working on identified pages and keywords.

In the site’s Pages Performance section, which updates weekly, you can access the dedicated analysis. The table shows, in each row:

  • the estimated monthly traffic range.
  • The number of pages that achieve the estimated monthly traffic in the selected range.
  • the contribution of those pages, i.e., the total estimated traffic volume aggregated for the pages in the selected range.
  • the number of total placed keywords that are present in the pages of the selected range.
  • the performance, which expresses as a percentage what is the volume of traffic derived from each of these groups of web pages compared to the total traffic volume of the site.
  • the crawl budget, a bar that reports the percentage of crawl budget committed by the selected range.

Clicking on the blue arrow at the end of a traffic range opens a tabular view of the Pages in the group, which lists precisely all the pages on the site that have an estimated traffic volume that falls within the selected range.

For each Web page there is information such as the URL, estimated monthly traffic, total number of keywords placed, and a final column with the hamburger menu with URL Actions for more targeted examinations.

In each Group you can use the Advanced Filter, search directly for a URL, and export the section data.

By clicking on a single URL from the list, you get a dedicated analysis full of useful information.

The first box informs you about the PZA, i.e., the Page’s authority metric; this is followed by the estimated traffic box, with an indication of potential (related to the improvement of keys beyond TOP10) and Page performance (performance represents how much you are getting compared to what you could get, in percentage). These boxes are flanked by the graph dedicated to the URL performance over time, from which you can also set a very useful feature (also present in other sections of the tool and signaled by a text message): by selecting a period on the graph, in fact, you can analyze in detail the keywords that have had variations in the set interval, to focus your investigations and verifications only on the moment that, for example, has seen a sudden drop in traffic and identify its possible causes. This analysis inside the analysis shows you the detail of the keywords that improved, worsened or kept their rankings stable in the time frame, with data on the average starting and final positions and the change in traffic found.

In the area below you can access the complete analysis on the keywords ranked, with a series of tabs that offer more useful information for your strategy, and in particular:

  • All keywords, a list of precisely all the keywords on the page under consideration.
  • TOP10, list of the keywords on the page that appear in the top 10 positions on Google.
  • Potential, list of keywords that are positioned near the first page of Google and that an optimization work could bring to TOP10, thus increasing the site traffic.
  • Distant, list of keywords positioned on the 4th and 5th Google page.

For all these tabs, SEOZoom offers a tabular view that reports detailed information about the keyword, such as ranking in SERP, changes from previous scan, estimated volume and traffic, average CPC, KO and KD, plus clickable actions from the hamburger menu to deepen the analysis on the individual keyword and individual URL.

SEO analysis, to perform a quick general analysis on the level of optimization of the selected keyword, also in relation to the competitors that are getting the best results.

Pages with Potential

In the Pages with Potential section you can see which pages detected by SEOZoom have many keywords placed on the second and third page of Google

Filters and column sorting can be a good help to analyze the data, and you can also export the single view or the whole grid for each table; moreover, through the hamburger menu you can also directly add the URL in Monitored Pages or perform other URL actions.

For each selected web page SEOZoom indicates a range of information, such as PZA, traffic (potential, reachable by bringing all identified keywords to the first page, and current percentage of return compared to the total site), change in traffic from the previous month, and total identified keywords (in the Keyword box). Then, by clicking on Enable page potential, you will have the chance to enable the visual representation in the graph of the potential of the URL under analysis.

The table on the bottom right, on the other hand, contains data on SERP position, ranking trend compared to previous scan, volume, average CPC, keyword difficulty, keyword opportunity, traffic estimated to be coming from the various keywords, plus the hamburger menu to launch more detailed analysis.

Through the various tabs you can deepen the analysis and only view the keywords in TOP10, the Potential ones (i.e. positioned on the second and third page) and Distant ones, i.e. keywords positioned beyond the third page of Google.

SEOZoom also provides you with an additional cue by dedicating a tab to Similar Pages, i.e., pages positioned with keywords in common with the one being analyzed: in this way, you can detect cases of cannibalization and solve these problematic situations.

The last tab pertains the SEO Analysis, which you can also access directly from this section.

Main Pages

The Main Pages group highlights the web pages of the site under analysis that currently have the highest traffic volume. For each URL, the estimated monthly volume and number of keywords placed is shown.

From this section you can check, as with Pages with Potential, the ranking data, the PZA, SEOZoom’s metric that indicates the authority of each web page, and also directly perform an SEO analysis.

From the “Traffic Trend” graph you can also see if the Page’s growth is stable or if there has been any particular sign of change from the previous 12 months, either positive or negative.

Pages with the most keywords

The Pages with the most keywords section lists the web pages that have precisely the most keywords placed in the top five search engine pages as a whole, with the possibility of checking all the information in detail.

This information is useful, for example, to find out how many and which pages have many keywords positioned on the fourth and fifth pages, so as to study possible optimizations that could lead to improved performance and results.

New Pages

The New Pages section highlights project site pages that have recently entered the SERPs. This section is extremely useful in a number of cases, because it allows you, for example, to check how quickly the content you publish manages to rank on Google or even to monitor the progress of a competitor (by creating a Project for their site).

Cannibalization

The Cannibalization section presents a tool that analyzes the pages of the project site to check for multiple URLs competing for the same keywords. This tool compares web pages with each other and indicates those that compete for the same keyword, thus risking hindering site performance.

The table with the list of problematic URLs contains the “Duplicates” column that indicates in percentage the possibility that in Google’s eyes this page is similar to another. Also, by clicking on the “Duplicates” button you can check which keywords are in common and which pages compete on the same data.

Be careful not to get confused: SEOZoom is not telling you that the text is duplicated or copied, but simply that, according to the scan performed, the indicated pages are ranking for the same keywords in a higher or lower percentage.

The URL-specific analysis table has data on SERP position, ranking trend since previous scan, volume, average CPC, keyword difficulty, keyword opportunity, the traffic that is estimated to be coming from the various keywords.

As with the other tabs in this section, you can focus the analysis on the keywords in TOP10, Potential (i.e., positioned on the second and third pages), and Distant, i.e., positioned beyond the third page, but also access the SEO Analysis directly.

Monitored Pages

With Monitored Pages you have a tool that allows you to manually enter specific pages or paths of the project site to be kept under close control thanks to SEOZoom.

Through this section you can also ask SEOZoom to save a page in its current state and add notes to indicate the changes made: in this way, you can check the progress of the page over time and thus the effects of the changes, as well as download all the various HTML versions of the page itself.

You can add Pages to be monitored by manually entering a URL or even directly a path, to monitor specific areas of the site identified precisely by a specific path; in addition, you can also subdivide URLs into Groups, to have a dedicated view.

By clicking on the URL you can analyze in detail the performance of the page and view the most important data for your strategy.

Sections

This feature allows you to monitor the performance of individual, specific parts of your site, defined by a unique “path” or “pathway,” so you can virtually create individual “micro-projects” related to these portions of your site.

To start the scan, you simply tell SEOZoom the URL of the path to be monitored and then display the data. The information is distributed in five TABs: Overview, Best Pages and Keywords, Pages with Potential, and Underperforming pages, which allow you to deepen your analysis by identifying which element to focus on.

For example, you could work on Pages with Potential (the URLs in the section that have keywords very close to the first page of Google) or Underperforming Pages (those that don’t rank with any keyword in TOP 10) to figure out what kind of SEO-side intervention could bring the greatest results.

From a practical point of view, you can use the Sections area to monitor the performance of specific categories of an eCommerce (but not only), or separately analyze the performance of an eCommerce and that of the blog in subfolder.

From a technical point of view, section metrics are calculated at the same time as the whole project metrics, so once a day; when you add a new section, you will have to wait for the whole project to be scanned to see the first results.

URL Inspector

URL Inspector is one of SEOZoom’s most powerful tools, it shows things that no other tool shows, but it is extremely complex and is designed for experienced, PRO-level users because it requires advanced professional expertise, insight, and analysis skills that may be “out of reach” for novices.

For this reason, it is reserved for Professional, Business and Corporate plans only.

Present within the “Pages” menu in the Projects area, when you start it URL Inspector performs a long and elaborate scan of all the pages of your project site with the relevant keywords placed on Google, and thus needs some time to provide the results.

The first aspect it highlights is already significant, because it allows you to identify whether you have optimized title and URL compared to your main competitors. It also gives you a way to see immediately whether you have hit the main keywords, the ones with the highest estimated traffic, or whether the strategy so far adopted by you (or by those who have preceded you in the activity on a client’s site) is out of focus and therefore a turnaround is needed to try to gain higher positions.

In the overall dashboard you can immediately notice four boxes, which tell you about total number of pages analyzed, percentage of optimized URLs out of the total, and then pages with the most searched keyword already used in the URL (and therefore already optimized) and pages where the most searched keyword was not used in the URL. These last two fields are clickable and allow you to immediately filter the respective view, so that only the list of URLs on which to focus your attention is activated.

At the bottom, however, there are three boxes: the table on the left lists all the pages on your site that have been analyzed, with an indication of the number of keywords placed, the estimated total search volume they might reach, and a checkmark (or a red cross) indicating whether or not the keyword is present in the URL.

Clicking on a row activates a second table, which analyzes the URL in detail and offers further guidance for optimization. First, here you find the list of all keywords with their key information, for a first overview of the strategy so far. Then, by looking at the box on the right, you immediately find out whether the keyword you are examining is addressed on other pages of your project site (similar pages) and how many competitors among those in the top10 on Google have chosen to use this keyword in the title. Here SEOZoom’s algorithm also gives you more specific “suggestions” for action, indicating, for example, whether you should work on improving the page or whether it would be better to focus your efforts on creating new content instead.

In this regard, you can further filter the view to get “ideas for new content.”

In this field, SEOZoom shows a list of all the keywords you could use in a new in-depth content related to a topic. After analyzing the possible presence of pages with similar content, the algorithm advises you to consider creating a new, more specific page to compete for a keyword not fully “centered” with the previous content.

Also in this area you can check if there are precisely pages with similar content and also what is the level of optimization achieved by competitors, through reporting the number of pages of competitors who have used the keyword in the title, to have more or less potential chances to reach the top10 of Google with adequate content.

The level of competitiveness of the keyword optimization can also be seen in the table, specifically in the TM and PM columns: Title Match informs you of the number of pages in Google’s Top10 that adopted exact match in the title and thus used the keyword exactly in the title, while Partial Match lets you know how many pages, as a percentage, used the keyword partially or with variants.

Basically, then, URL Inspector supports professional work on sites, particularly client sites, because it is used to identify the type of strategy adopted at the level of keyword research and content creation, particularly with respect to optimization choices for the title and URL fields, so as to identify any errors or problems.

Competitors

The Competitor section is designed to allow you to analyze and compare your data with that of your direct online competitors (using the list of competitors you added in the project settings as a starting point).

From the General Summary dashboard you can see a series of charts that put the domains flagged as “competitors” in “competition”, thus helping you analyze the traffic volume of various projects.

You can take advantage of the various actions available from the hamburger menu for direct analysis of individual domains, namely: Analyze Domain or Root Domain where present, browse the Domain directly (SEOZoom will open the navigation in another tab), analyze the best keywords or directly compare the project site with its organic competitors.

Let’s start looking at the graphs in detail.

The first one shows the performance of your site and the one selected as a competitor, with the possibility to analyze the information by date and period.

Scrolling down the page you can view the bar graph showing the competition on keyword distribution, that is, the exact amount of keywords that are ranked on the first, second, third, fourth, and fifth page of Google.

Within the bubble graph, on the other hand, you can check the performance of websites competing on the same keywords; in particular, traffic and number of keywords are analyzed.

From the Competitors Detail tab, you can instead deepen the analysis by comparing different views to check the difference in ranking and performance. By selecting a Competitor from the table on the left, you activate a series of information that is useful for you to make verifications and study the best strategies.

The different views available allow you to delve into a number of aspects related to the keywords of the Competitors versus those of the project site, and in particular:

  • Content GAP: lists the Competitor’s Top keywords for which the Project site lacks content in SERP
  • Keywords in common: reports the keywords for which both domains are ranking
  • Keyword on which you are losing: indicates the keywords on which the Competitor is ranking better than the Project site
  • Keyword on which you are winning: groups the keywords on which the Project site is ranking better than the Competitor
  • Competition in TOP10: shows the keywords in TOP10 for which the two domains are in direct competition.

From all these tabs, you can also launch more in-depth analyses on the individual keyword or related URL positioned by simply selecting one of the actions in the hamburger menu.

Analytics

By connecting the account to Analytics, SEOZoom provides a simplified view of several dashboards of the Google’s platform, which can be useful for you so to have at a glance a range of strategic information to monitor and improve your site’s performance.

Notepad

With this feature you can simply write notes that will help you keep track of information, updates or other notes that you may need during optimization work.

You can add a note from this specific section or from some of the charts and sections within Project (e.g., the Project/Domain Overview chart and the Pages section).

Your groups

Here you can create and manage groups of projects to get an overview of their performance. This is very useful if you want to have an overview of the performance of all projects of a specific client or a network of thematic sites.

If you click on the number on the right in white you can check the total number of groups you have created, while the + sign allows you to quickly create a new group.

Analyze: Keyword, Site, URL

To make your optimization efforts and studies actually strategic, you need data that is up-to-date, quick to read, and at the same time rich in information.

SEOZoom offers you three different types of analysis – Analyze Domain, Keyword and URL – directly from the search bar, with which you can get in-depth data with advanced metrics that will be the building blocks to make your SEO work successful.

Analyze Keyword

To launch a keyword analysis you simply have to type the keyword you are interested in in the top bar and click on “Analyze” or press enter from your keyboard.

At the top of the screen you will immediately be able to read some useful data, summarizing the main strategic information related to the keyword, namely its monthly search volume, estimated Keyword Difficulty and Keyword Opportunity, total number of indexed pages, cost per click and seasonality.

Specifically, the first box reports the figure for average monthly search volume, showing in parentheses the range of variation related to seasonality (minimum and maximum value that the volume can reach based precisely on the different times of the year).

This is followed by two boxes related to SEOZoom’s two keyword metrics, Keyword Difficulty and Keyword Opportunity, both of which are characterized by a color scale that makes it easier and faster to understand the data.

Keyword Difficulty represents an estimate of the difficulty of ranking in SERPs for the keyword under consideration compared to the level of competition among the domains in TOP10. It ranges from 0 to 100, with the highest value signaling the greatest difficulty of ranking for that keyword; the metric analyzes the sites ranked in SERP for that keyword and their ZA: the more competitive the sites, the greater the difficulty of ranking.

Keyword Opportunity, on the other hand, helps you assess how many opportunities you have to rank in TOP10 on Google for the keyword analyzed: it takes into account two factors, namely the Trust of competitors and the level of optimization of pages that are in TOP10 for that specific keyword. This metric also ranges from 0 to 100, and a high value means there are more opportunities to attack the SERP and rank highly.

The next box shows the number of Indexed Pages for the keyword entered and the quantitative change since last scan: clicking on Trend opens a pop-up graph that allows you to follow the evolution of indexed pages over time. To the right is then a box indicating the average CPC, from which you can also access the trend graph with the number of ads on the first page (a value provided by Google Ads and ranging between 0 and 1, which indicates the level of competition present among Google Ads).

This dashboard concludes with the Seasonality box, which reports the historical monthly change in the search volume of the keyword analyzed and also reports, with different color graphs, the previous year’s trend and the value estimated by Zoom Trends, which you need in order to know what the current search trend really is. By clicking on Show Trend you can deepen the trend analysis, activating a pop-up graph that shows you the detail of the search volume in the average year, again with the graphical representation of the estimated volumes in real time.

Immediately below you will also find quick information about the keyword’s main search intent type (Informational, Navigational, Commercial, Transactional) and the box dedicated to Content Focus analysis. This metric shows the percentage distribution of search intent of users interested in that particular content and is derived from the analysis of the pages of competitors positioned in the top10 on Google and the intent of all keywords satisfied by their pages. Please note: the sum of the percentages may not be 100%, but this is normal since the same keyword can also have multiple search intent.

The box showing any SERP Features on the search results page follows.

In the central part of the page you can notice four different tabs: SERP Info, Competitor Info, Search Intent, and Correlated Keywords, which activate the display of specific insights. Further to the right you will find buttons that allow you to add the keyword under consideration to your Keyword Research or Keyword list (depending on the insertion mode you have set).

SERP Info

By clicking on SERP info you can immediately see the SERP Trend, which is a list of the first 50 results placed in the SERP related to the keyword under consideration, with an indication of the placed URL, ZA value of the domain, PZA of the URL, change in ranking compared to the previous scan, and the ability to perform URL Actions and Domain Actions through the hamburger menu. By clicking on the various placed sites you can activate the visualization in the graph Websites Trend in SERP, which shows you precisely the ranking trend of the different pages with respect to the entered keyword.

The second function allows you to analyze Traffic Share, which is the percentage distribution of the total traffic generated by the entire cluster of keywords that refer to the search intent, thus extending the analysis not only to the main or inserted keyword, but to the entire related set. In this way, you can quickly visualize which domains have the best page for the searched keyword, those that have produced the most compelling content for Google.

Closely follows the SERP History tab for the keyword under analysis, setting the date to compare SERPs over time and the possibility to launch a domain or URL analysis. In addition, SEOZoom also reports to you the level of SERP variability compared to previous scan, showing you the percentage value of SERP variation, of only the TOP10 results and positioned Domains.

With SERP Analysis, on the other hand, you can get even more timely and in-depth information about the composition of Google’s search results page for the keyword under consideration. SEOZoom describes to you the structure of the SERP, pointing out the presence of any Google boxes and features and the precise position they occupy on the page (showing the number of pixels from the top), and proposing the same information for all the elements that make up the page, thus including the organic results; in addition, you can also find out which results are above the fold and which are only visible after a scroll, so you can begin to actually assess the organic competitiveness of the SERP and make informed assessments regarding strategic opportunities to work on the keyword for your site.

On the right side of the screen you can display other information you might need for your strategies, such as the relationship between Google elements (Google Panels) and organic results on the page, the possible presence of a direct response from Google and list of all SERP features triggered by the keyword, such as an Image Carousel, Frequently Asked Questions Box (also showing the questions present, which can also be used for targeted content creation, for instance), results from Google News, Local Search map, videos from YouTube and so on, up until the box with related searches that Google suggests to its users, still in relation to the analyzed keyword.

Competitor Info

With the Competitor Info section SEOZoom provides you with a real time analysis of the URLs positioned in TOP10 for the keyword under analysis, with the possibility to indicate a URL of your choice to compare it with those present.

In the central table you can read all the useful information for the positioned web pages, and in particular the ZA, the Page Zoom Authority, the estimated monthly traffic volume, the number of kws in the top ten and on the second page, as well as the total number of keywords ranked. This is followed by some indications related to the level of optimization of the page and its content, which allow us to find out at a glance whether the keyword under consideration was used in the Title, URL, H1, H2 and H3, and then the data of total number of words present in the main content and intent match percentage, as well as the hamburger menu to launch URL Actions.

When you click on the arrow at the beginning of the individual row, you activate the SEO analysis for that page, which presents you with in-depth data on the level of optimization of its content. Specifically, you can view a box focused on Search Intent, which analyzes the text of the content to determine the value of Intent Match, Topic used, and Relevant Keyword; the lower box, on the other hand, shows what title and meta description you have set, and even further below you find the page’s optimization level estimated by SEOZoom for the various parameters.

On the right, instead, you have access to three different tabs: the first gives you an overview of SEO Optimizations, pointing out which best practices have been met and which are the issues in the examined URL with respect to content management. This information is especially useful when comparing your URL with competitor pages, because it allows you to understand if and how much the competitors positioned in TOP10 have optimized pages, and to consequently set a more targeted strategy to climb the SERP.

The Use of Keyword inside Tags tab allows you to analyze in detail how much and where the keyword under consideration is used in the content tags, and thus in title, H1 header, anchors for any links, and image alt text.

Lastly, you can also find out if keywords that refer to the same search intent and have search volume are used in the text.

Search Intent

The Search Intent section represents the heart of keyword analysis, because it goes beyond the classic values and metrics of the single keyword to delve precisely into the search intent, the search intention of users identified by Google, an increasingly central aspect in the most modern SEO and keyword research activities.

SEOZoom’s innovative algorithm is able to first identify whether the keyword being analyzed is the main keyword of the focus or not (and gives you the ability to immediately set up an article with the keyword under consideration).

In the case of the keyword “seo”, for example, the algorithm indicates that it is a Main Key. Conversely, if you analyze a keyword such as “Classic Apple Pie“, the algorithm indicates that it is not a Main Key, thus suggesting that you focus your content on the Main Keyword, which we can discover by clicking on “Move to Main” (in this case, it is “Apple Pie”).

On a general level, it would be preferable to set an article on the Main Keywords to increase the chances of ranking on Google, but this does not mean that it is not possible to continue working on optimizing content for a secondary keyword or a very specific long tail keyword, depending on the cases and contexts.

In the next four boxes we find very important information that will then be discussed in more detail further down the page, and that analyze the keyword not as a single entity, but as an element of a cluster of keywords afferent to the same intent.

  • Total Main Intent Volume

The total search volume for which you can potentially compete with a single article, calculated on all keywords included in the main search intent.

  • Keywords with the same Intent

The total number of keywords with the same search intent as the main keyword.

  • Main Topics

The number of relevant topics identified by analyzing the content of sites in TOP10: they represent some important focuses to be considered in the article.

  • Secondary Topics

These are all the keywords and topics related to the intent, but which you should take into account to write related in-depth articles, since search engines are preferring topic-specific pages and a general article focused on the Main Key.

You can elaborate on these three aspects – Keyword with same Intent, Main Topics, Secondary Topics – in the appropriate tables, which provide you with a series of valuable information for your content strategy.

The first table lists keywords with the same search intent, those you can potentially place with a single article focused on the Main Keyword, indicating for each its search volume, average CPC, seasonality, and two innovative metrics: SERP affinity and In Content. The SA tells you how similar the SERP of the term you are analyzing is to that of the Main Keyword, expressing a percentage value from 0 to 100: in practice, it tells you how many results in common there are between the two SERPs. The “In content” value refers to the percentage of competitors positioned in TOP10 who used the row keyword within their content. With the filters and additional features you can also set custom views, for example, “discarding” keywords not used by competitors (those with IC equal to 0) or sorting the keys by the SA column. Moreover, on the right side you will find the Frequently Asked Questions from users about the topic, which can become suggestions that you can leverage for content creation.

You can then move on to the analysis of the main topics, listed by concept and relevant term in the table on the left, where you can also check the number of correlated keywords, potential traffic volume, and SA and IC values. For each topic you can delve deeper into what relevant keywords are identified by SZ, which in the right table informs you about the corresponding values of search volume, average CPC, seasonality, SA and IC, so as to give you all the insights to create strategic content and organize the keywords.

The last table is dedicated to secondary topics, with a list of keywords with which you could deepen the main topic with related articles that offer a different focus on it, to be taken into account when creating an internal link structure. In this case, the table shows all identified secondary keywords, with an indication of the corresponding average search volume, number of keywords that pertain to this intent, and consequent potential volume that you can reach with a tailored article.

Correlated Keywords

The keyword analysis is completed with a fourth tab, Correlated Keywords, which sends you directly to the Keyword Infinity tool, already set up on the analysis of the keyword you are interested in and with the possibility, therefore, to deepen this term with all the features you have available in this section .

Analyze Website

Type in the bar the domain you want to analyze, press enter or click on Analyze: in this way you get a complete panoramic snapshot of the site’s performance on Google, with lots of useful information to study an organic competitor or any site of your interest.

In addition to the information in the dashboard, you can also focus your analysis on four more specific areas, as is the case of the projects area, and then access the Sectors, Keywords, Pages and Organic Competitors features.

Website Analysis is the first screen that summarizes the behavior of the analyzed domain on Google.

It is good to know that you can also export the data shown, by clicking on the PDF icon or the Quick Audit button. In the first case, SEOZoom quickly and automatically generates a site report, a file that simply shows the data from the tables, while Quick Audit (available from the Professional plan up) is a more detailed tool, which takes the form of a real SEO analysis of the site. In fact, the self-generated document also walks you through the insights, providing useful hints to understand what the values shown mean and, therefore, to quickly assess the site as a whole.

Going back to data and tables, the first information you find in Website Analysis is the domain’s position in the overall ranking of UK sites (or whatever other database you are currently using for your analysis) and in its main category of relevance. Moreover, if the site you are analyzing also manages to compete on the international versions of Google tracked by SEOZoom, here you can read a summary report of its performance, and in particular its traffic volume (with an arrow quickly indicating the trend), number of keywords placed, number of keywords present in TOP10 and Zoom Authority level, all based on that specific version of Google.

Also appearing on the same line is the “Create a Project” button, which precisely allows you to create a new project for the site under consideration; other “utilities” include those that take you to the video explanation of the section and the Manual, or that allow you to set the text size of the tables, to adapt the display to your screen, and to share metrics by generating an image file (by hiding or keeping visible the domain indication).

Delving deeper into the tool, the analysis begins with 4 colored boxes summarizing your site’s performance:

  • Ranked Keywords tells you precisely the overall amount of keywords placed on Google (with numerical variation from previous scan). Clicking on the box leads you to the Keyword Studio section, where you can further analyze the keywords of the site you are checking.
  • Monthly Traffic reports data on the estimated monthly traffic volume of the site’s pages, with a side icon that tells you whether the variation from previous scan is negative, positive, or stable. You can elaborate on this data in the table right below it, which shows you the value of the site’s monthly organic traffic volume on a quarterly basis up to one year ago, with the option, by clicking on “prediction” to also launch a predictive analysis over the next 12 months (with aggregated values or broken down on a monthly basis).
  • Traffic value indicates the investment you would have to make with Google Ads to get the same rankings that the site got with organic traffic. The figure is on a monthly basis and the value is constructed using the sum of all Ads CPC values of the individual keywords for which the site is ranking on the first page on Google.
  • Zoom Authority, which shows you the ZA value estimated by SEOZoom. By clicking on the box, you can also check the trend of this metric over time, and also analyze the changes for the other Opportunity, Stability and Trust metrics of the domain in question.

Speaking of authority, then, you can also check in detail what the site’s Topical Zoom Authority values are in all the vertical sectors the site is currently ranking in (and by clicking on “view all” you can study in detail the site’s rankings in individual categories), and also the individual level of Trust, Stability and Opportunity.

TO KNOW MORE ON AUTHORITY ZOOM AND OTHER METRICS: read here

This part of the tool closes with the Backlinks box, which summarizes the numbers of links received by the site, reporting the total, the domains hosting those links, and the amount of Referring IPs.

On the right, then, you will find a graph on the historical performance of the site, reporting to you the fluctuations in traffic volume (the metric taken on the y-axis) over time (the value on the x-axis). By viewing the individual “dots” on the graph, which are SEOZoom’s scan checkpoints, you can also precisely check the date, traffic volume, and total number of keywords selected, while on the horizontal axis you will notice some Google icon symbols, which represent the dates on which relevant updates to the search engine’s algorithm were released (and you can also know more about them).

By activating “Seasonal Trend“, on the other hand, you can check on the graph for any deviation between the search volume actually achieved by the site and the one predicted by seasonality (represented by the curve filled in blue).

By manually selecting a period on the graph, you can generate a “Time Machine” report for the dates you set.

Clicking on the “Keyword Distribution” tab activates the graphical display on Google keyword rankings (vertical axis) over time (horizontal axis) for the site under consideration. In this case, SEOZoom also visually shows you the keyword distribution within the first 5 pages of the search engine, chromatically distinguished.

The data on the current distribution of keywords on Google for the examined site can also be found in the chart immediately below the table; next to it, however, you can find out which are the Main Sectors for which the domain has keywords positioned, with a chart showing you the percentage distribution of traffic over only the top 5 verticals of greatest relevance.

This is followed by 3 charts that anticipate the detail on the site’s keyword analysis, specifically:

  • Best Keywords, which shows the top 10 keywords ranked by search volume, usually those that are in the TOP10 on Google and thus provide the most substantial contribution to site traffic.
  • Important rising keywords, which lists the top 10 keywords, based on search volume, that have experienced a positive variation since previous scan.
  • Important dropping keywords, which reports the top 10 keywords, based on search volume, that have experienced a negative variation since previous scan.

All three tables present detailed information about the keywords, such as their ranking position, any change from previous rank, search volume, estimated current visits generated by the keyword, and variations from previous scan (only for important rising or dropping keywords), KD and KO level. By clicking on the hamburger menu at the end of each row you can activate Keyword Actions, while the “view all” button allows you to check the detail of the examined keywords within the relevant section of Keyword Studio.

The last part of the Website Analysis dashboard focuses on the analysis of the entered domain’s competitors, automatically identified by SEOZoom.

Specifically, the Organic Competitors table shows a list of websites that compete for the same keywords as the analyzed site: the various columns allow you to find out the level of competitiveness (the percentage of keywords in common between the site under review and the competitor domain – to exemplify, if the level is 100, it means that the competitor site appears in all the SERPs in which the analyzed site also appears); the ZA, the keywords ranked, the Top Keywords in common (the keywords with higher search volume and ranking for which both sites compete), the traffic trend (with respect to the two time checkpoints, with quantitative indication of the actual change), the estimated search volume of the two sites, and the difference between the two values. Closing the row is the hamburger menu, which leads you to the domain actions with which to further study the competitor site.

The Main Competitors Estimate graph basically shows you the previous information except now in visual form, distributing the competitors (represented by circles of a diameter that is proportional to traffic value) in relation to traffic value (vertical axis) and total keywords (horizontal axis).

Sectors

The Sectors tab allows you to instantly get a strategic overview of the keywords for which a particular website is positioned in each sector identified by Google, with a range of data and information to further your study.

The tool displays a dashboard divided into three parts.

The table on the left shows the sectors and categories recognized by Google for which the domain has placed keywords, as well as the domain’s position in that ranking.

In the table on the right, called Keywords per Sector, you can check precisely the list of all keywords related to the previously selected category. For each keyword you can read its SERP position, average search volume, intent type, presence of SERP Features, CPC value, URL of the positioned page, seasonality, keyword difficulty and keyword opportunity values, and by clicking on the hamburger menu you can access the Keyword Actions and URL Actions functions.

The highlighted boxes above the table, on the other hand, show the site’s crucial information for the selected category: Ranking Position, Topical Zoom Authority, Total Search Volume of all keywords placed in that sector, Total Number of Keywords placed in the sector.

Keywords

The Keywords section available from “Domain Analysis” allows you to delve into the main aspects related to the analysis of the keywords on which the site competes, and in particular to find out which keywords are the best and potential ones, to know the ones that are rising, falling, those that have entered or left the TOP10, up to viewing all the keywords for which the domain you are studying is positioned.

In much the same way as with a project site, SEOZoom allows you to use the Keyword Studio features, which are the heart of our keyword study tools.

From the main dashboard start different path of analysis, different visualizations and tables that keep you up-to-date on the Keyword trend of the analyzed site.

To be precise, you will find 7 different study angles, namely:

  • Ranked Keywords.
  • Traffic Increases.
  • Traffic Drops.
  • Potential Keywords.
  • Featured Snippets.
  • SERP features.
  • All site keywords.

For the analytical description of the different visualizations, we refer you to the similar Keyword Studio feature in the Projects area (compared to which, in this section, only Keyword Branded is missing, related to the brand setting in the project itself).

Pages

With the Pages section you can analyze, monitor and understand the level of optimization of the web pages of the site you are analyzing through a number of different functions and “angles.”

Specifically, the dashboard allows you to immediately view the list of the best pages on the site, those that are making the greatest contribution in terms of traffic and that have the most keywords in TOP10

For each URL, the estimated monthly volume figure and the number of keywords placed is shown.

By selecting a URL, on the right you can check other useful information, such as its PZA, traffic (potential, reachable by bringing all keywords identified to the first page, and current percentage of return compared to the total of the site), change in traffic from the previous month, and total keywords identified (in the Keywords box). Then, by clicking on Enable pages potential, you can enable the visual representation in the graph of the potential of the URL under analysis.

In the table on the bottom right, on the other hand, there are data on SERP position, ranking trend compared to previous scan, volume, average CPC, keyword difficulty, keyword opportunity, the traffic that is estimated to arrive from the various keywords, plus the hamburger menu to launch more in-depth analysis.

Through the various tabs you can deepen the analysis and view only the keywords in TOP10, Potential (i.e. positioned on the second and third page) and Distant (i.e. keywords positioned beyond the third page of Google).

SEOZoom also provides you with an additional cue by dedicating a tab to Similar Pages, i.e., pages positioned with keywords in common with the one being analyzed: in this way, you can detect cases of cannibalization and solve these problematic situations.

The last tab concerns the SEO Analysis, which you can also launch from this section to perform a quick general analysis on the level of optimization of the selected keyword, also in relation to the competitors that are getting the best results.

Organic Competitors

The competitor section is structured in a way that allows you to quickly check and compare the analyzed site data with those of direct online competitors, automatically identified by SEOZoom based on the level of keywords in common.

The functions are very similar to the homonymous section in the Projects area.

The main dashboard – General Summary – immediately shows you the list of identified competitors, with the possibility of removing one of the domains from the list or manually entering another site. To analyze the data and evaluate the different performance, you have at your disposal a series of graphs that put in “competition” the domains reported as “competitors”: the first simply reports the temporal trend of the volume of organic traffic achieved by the selected site compared to the one analyzed.

Scrolling down the page, then, you find a bar graph that shows the competition on keyword distribution (so how many keywords are placed in the first, second, third, fourth and fifth page of Google), and a bubble graph that makes more immediately visible the size level of the competitor, based in particular on traffic volume, number of keywords placed and ZA.

By clicking on the Competitors Detail tab you can continue your analysis and select a Competitor from the table on the left to activate a range of information that is useful for you to make verifications and study the best strategies. In particular, you can launch comparisons based on:

  • Content GAP: lists the Competitor’s Top keywords for which the Project site lacks content in SERP
  • Keywords in common: reports the keywords for which both domains are ranking
  • Keyword on which you are losing: indicates the keywords on which the Competitor is ranking better than the Project site
  • Keyword on which you are winning: groups the keywords on which the Project site is ranking better than the Competitor
  • Competition in TOP10: shows the keywords in TOP10 for which the two domains are in direct competition.

From all of these tabs, you can also launch more in-depth analyses on the individual keyword or related positioned URL by simply selecting one of the actions in the hamburger menu.

Analyze URL

The third mode of analysis you have at your disposal with SEOZoom, after those focused on keywords and domains, concerns a specific page through manual entry of its precise URL.

When you launch the analysis of a URL that has keywords placed on Google you immediately get an initial Dashboard that summarizes a series of useful and practical information. In fact, you can immediately know in detail a series of insights, divided into:

  • URL Metrics, to find out the values of Zoom Authority and PZA – Page Zoom Authority, the two original SEOZoom metrics that present a value from 0 to 100 and indicate the Page’s authority based on a mix of elements, including keywords ranked on the first Google page, potential keywords and traffic volume.
  • Organic Traffic Performance, a mirror that summarizes the values of current monthly visits (in green), potential visits by bringing all keywords to the first page (in orange), and current versus potential performance (red) of the analyzed URL.
  • Keyword Yield, a mirror that summarizes data on the number of keywords in TOP10 (green), total keywords in the top 50 positions (in orange), and percentage of keywords placed in TOP10 compared to the total (red).
  • ADS coverage, which helps you understand by how much the “traffic value” of the page could improve if all placed keywords made it to the first page on Google. The figure represents the percentage deviation between the two values presented in the boxes Coverage (the sum of the CPC of the keywords you have on the first page, in blue) and Total CPC (the sum of the CPC of the keywords you do not currently have on the first page, in light blue).

You now have the ability to take the analysis to a greater level of depth, thanks to several tabs that lead you to further practically examine every aspect related to the page you are interested in and also its current level of optimization.

The first section is called Overview and gives you access to the classic useful information about the ranking of the URL under analysis, and in particular to the distribution of the keywords positioned within the first 5 pages of Google, to the graphical performance of the page itself over time (with the possibility of activating Enable pages potential to enable the visual representation in the graph of the potential of the URL under analysis), to the complete list of the keywords positioned and to any pages of the same site at risk of cannibalization, since they are related to the same topic or compete on the same keywords.

Competitors

In the Competitor tab, on the other hand, you can analyze pages from other domains that compete with the one under analysis, automatically identified by SEOZoom on the basis of common keywords.

For each competitor URL you can see the estimated traffic, its PZA value and Traffic Share value (expressed as a percentage, to quickly figure out which URL is taking the most traffic from the intent keyword cluster) in the table on the left, while on the right you will find the URL analysis dashboard that allows you to deepen the analysis of the page and its performance through the “classic” boxes, graphs and tables full of information and insights.

URL Intent

The URL Intent tab is an innovative SEOZoom feature that, thanks to its algorithm, is able to identify the main keyword of the search intent underlying the analyzed content and, in this way, study the page performance going beyond the “old” analysis systems.

In this way, you can examine the Search Intent related to the URL being analyzed, with a range of data inherent in the intent match, competitiveness, and keywords related to the topic.

The dashboard immediately shows you five boxes: the first one tells you the main keyword identified by SEOZoom (and gives you the possibility to change it manually, if you think the main keyword of that URL is another one) with its range of monthly search volume; the Total Main Intent Volume (i.e., the total search volume calculated on all the keywords pertaining to the search intent identified for the URL); the intent match percentage (how much the analyzed page matches the search intent); the URL competitiveness percentage (which indicates how competitive the analyzed page is, how much it manages to compete on all the keywords referring to the search intent); indication of the best URL for the identified intent (which indicates precisely which is the page that is getting the best performance and most traffic for the identified search intent), with estimated traffic values, number of keys in TOP10 and total number of keywords placed, as well as the chance to analyze this URL in more detail.

Immediately below you will find useful pointers related to any secondary keywords that might be worth considering in a content strategy that wants to go deeper into the topic. The table with secondary topics gives you exactly a list of keywords with which you could deepen the main topic of the analyzed page with related articles or with optimization of the already published content. In particular, SEOZoom tells you which articles are already present that should be improved, which articles only partially cross the intent, and – last but not least – which topics that are not currently covered in any article.

SEO Analysis

Moving to the SEO Analysis tab you get a complete analysis on the optimization of the Page in relation to the indicated key, which can also be varied in case you are interested in delving into a different keyword than the one identified by SEOZoom.

Among the various in-depth data on the level of optimization of the content you find, in particular, a box that reports the main key and its values, and then still another box focused on Search Intent, which analyzes the text of the content to determine the value of Intent Match, Topics used and Relevant Keywords, and another section that shows you what the title and meta description set are and, again, the level of optimization of the page estimated by SEOZoom for the various parameters.

This is followed by a dashboard divided into 4 tabs that allows you to really get a better understanding of the optimization level of the content of the page under consideration, with a number of suggestions divided into the sections:

  • Optimizations
  • Topics
  • Keywords
  • FAQ

In the Optimizations tab you have a summary table with points to consider in order to have a well-optimized article based on SEO best practices, both technical and structural.

In the Topics tab you have an analysis related to recurring topics related to the chosen keyword, while in Keywords you can see instead a list of other keywords potentially related to the identified target keyword, divided into All, Fundamental, Recommended, Optional, Additional, Missing. For each of them, you can select a keyword and SEOZoom analyzes for you if and how they were used by competitors, providing you with the average search volume. In the other tabs on the right (H1,H2,H3, A, IMG, Sentences), the tool scans the top 10 SERP results for the target keyword and tells you what headers, links, images, and seentences the competitors used the keyword in.

In the end, in the FAQ tab, SEOZoom brings you the users’ most frequently asked questions about the topic, as identified by Google.

Text Analysis

Back to the main tabs of Analyze URL, you then find Text Analysis, which gives you a graphical view of the structure of the content and thus allows you to take a look at the way keywords are used on the page. First, SEOZoom shows you a pie chart with the most used sentences, also offered in a bar graph version.

The table allows you to deepen this analysis, listing all the keywords previously highlighted, distinguished according to the keyword extension (i.e., if it consists of one word, two words, and so on, up to 6 words).

For each keyword you will find in the table information on search volume, number of occurrences on the page, percentage of keyword density (i.e., the frequency with which the term or group of terms is present in relation to the total number of words), and – in the Info column – indication of the position in the content where the keyword is present, i.e., whether, for example, it is in the title, in the main header, in the h2, and so on.

Analyze Question

In the SEOZoom’s search bar you also have the opportunity to launch a search based on questions: when you type in a query, in fact, you can select the “Question” option from the context menu and then find out whether it is actually related to possible user queries.

By launching the analysis, you get the information about the question and the queries in which Google will presents it within its features, such as the “People also ask” box: the screen immediately shows you the total search volume of the keywords in which it appears, the total number of those keywords, the average values of KD, KO and CPC, and then the total number of related questions, i.e., the other questions that users interested in the topic usually ask and that Google then shows in its SERP.

By clicking on a new question you can delve into its data, thus discovering the total number of keywords that trigger it and so on.

Knowing the questions means understanding what the users’ true needs are and what can properly serve them, and this mode of research also allows you to identify the relevant keywords you need within your content to answer those intents in a comprehensive and useful way.

Analyze Root Domain

SEOZoom also allows you to analyze the Root Domain, if subdomains are present: simply enter the domain URL and, in the “Type of Search” drop-down menu, select “Root Domain”.

With this type of analysis you can get useful insights into the performance of the domain as a whole.

In the first box in the top left corner, in particular, you can read the values related to the number of total domains placed, total keywords placed, estimated total monthly traffic generated, Total Traffic Value for all domains, Zoom Authority of the Main Site. Immediately below, then, you will find the graph with the distribution of keywords placed within the first 5 pages of Google.

On the right, on the other hand, the pie chart shows you the distribution of traffic, and thus makes you understand at a glance how much each domain and subdomain contributes to the total organic traffic value of the site you are analyzing.

This is followed by a tabular list of all subdomains, from which you can also proceed to analyze an individual site, with immediate indication of traffic value and ZA, and the ability to go even deeper with the Domain Actions that you can activate from the hamburger menu. By selecting a single value from this table, you change the view of the graph on the left, which shows you the subdomain’s traffic trend over the time frame available.

Finally, as you scroll down the page you find a series of individual “boxes” dedicated to all the subdomains afferent to the analyzed site: of each you can preview the homepage and information on total keywords, estimated traffic value, estimated traffic quantity figure, Zoom Authority level, and percentage of traffic generated compared to the total site.

Competition

The competition section of SEOZoom is designed to help you quickly run a comparison between two or more websites for an analysis of direct competitors in the same market niche as you, and to get information on traffic volume and keyword rankings.

Within this area, found in the side menu, you can use the Domain Vs Domain, URL vs URL and Competitors on keywords list tools. Let’s now go through the various sections in detail.

Domain vs Domain

Domain vs. Domain is a tool that allows you to compare your site with up to 5 competitors to unearth their strengths and identify subject areas where you may be most lacking.

Specifically, by launching the analysis you can view the traffic data of the domains, find out their estimated monthly traffic volume, and check the keyword distribution for each page.

To get started, you just need to type the URL of the main domain to compare with competitors in the text box that appears on the page, point to a competitor domain and click on Analyze to launch the SEOZoom scan.

In the dashboard that appears you will find a lot of useful information for your strategy, as well as the possibility to manage the sites to be compared: in fact, from here, you can add the other competitors, up to a maximum of 5, or possibly remove a site that you no longer want to compare with the others.

But let’s delve into the meaning of the offered data.

In the General Summary tab you will find the first useful data on the domains entered in the competition, and in particular you can also visually check the trend of their performance on Google in the graph on the right, which shows the fluctuations in traffic over the period analyzed.

At the bottom we find the graph with the distribution of keywords for the different sites being analyzed, which shows the total number of keywords placed broken down for each Google page. The next graph, Main competitors estimate, relates the traffic volume and the total number of keywords of the various domains under analysis, represented with a diameter that is proportional to the value.

To deepen the analysis you can go to the Competitors Detail tab, where SEOZoom shows a real in-depth look at the keywords ranking for all the domains under analysis, as is done in the similar tool found in the Competitors section of the Projects.

The different visualizations available allow you to delve into a number of aspects related to competitor keywords versus those of the site you have set as your main one, so that you can devise more informed strategies-for example, when creating an editorial plan, it is useful to know which competitor URLs cover topics that are missing from our site.

Specifically, you will find five tabs:

  • Content GAP: lists the Competitor’s Top keywords for which the Project site lacks content in SERP
  • Keywords in common: reports the keywords for which both domains are ranking
  • Keyword on which you are losing: indicates the keywords on which the Competitor is ranking better than the Project site
  • Keyword on which you are winning: groups the keywords on which the Project site is ranking better than the Competitor
  • Competition in TOP10: shows the keywords in TOP10 for which the two domains are in direct competition.

You can also use the search filter to check keywords directly, further analyze using the Keyword Actions included in the hamburger menu, and export the table data you are viewing, in xlsx or csv format.

URL vs URL

In the URL vs URL section you have a perfect tool for drawing information from the URLs of one or more competitors, with which to figure out how to improve your own web page.

The analysis can start in two distinct ways: by manually entering at least two distinct URLs that you want to delve into, or by clicking on “Suggest URL” which, based on a keyword, shows you a list of URLs placed in SERP to choose from.

You can analyze up to 50 URLs from different domains at once.

The dashboard in front of you is now called Competition and is divided into three areas.

In the first tab, Competing Pages, you immediately have direct comparison of the metrics of the analyzed URLs and specifically their estimated monthly traffic values, page zoom authority, zoom authority of the entire domain, the number of total kws for which each individual web page is ranked, and the amount of kws in the top ten. In addition to this, there is the total CPC value, which is basically a potential estimate of the sum of all keyword CPCs to give you an idea of the value this page might have, even considering the CPCs of the various keywords.

On the right, however, you find the Page Performance section, which provides you with an analysis overview for each URL analyzed, with summaries of the main information useful for understanding the page’s performance. In particular, you will find here the indication of the PZA, the detail on traffic (current, potential and performance percentage), the variation from previous month and the focus on keywords (with specification of those positioned in TOP10, the potential and the distant ones, with percentage data compared to the total). In addition, from the graph you can view the traffic fluctuations of the URL and activate “enable pages potential“, the visualization that lets you see at a glance what the potential traffic might be if all the keywords for which the page is positioned were present within the first page of Google.

The next table deepens the analysis on the keywords present on the selected page, broken down into a series of tabs according to their ranking. You then find all the keywords present on the selected page, and then those in TOP10, Potential (thus present on the second and third Google page), Distant (positioned on the fourth and fifth Google page), and Similar Pages (any URLs from the same domain positioned for keywords in common). All of these tables contain SEO information about individual keywords, such as position on Google, variation from previous scan, search volume, estimated traffic value that the keyword brings to the website, the average CPC, KW Difficulty and KW Opportunity; you can also filter to refine your investigations, or search for specific keywords; moreover, with the Keyword Actions that can be activated from the hamburger menu you can study even more in-depth the keyword that interested you.

Finally, the table is completed with real-time SEO analysis, the heart of SEOZoom, which allows you to check how the main kw was inserted and treated in content creation. Here you can see all the details about optimization, topics that were or were not used, keyword optimization and so on, with lots of information that can be useful to you, especially if you are spying on a competitor’s page.

The other section of URL vs. URL is called “Competing Keywords” and presents you with a comparison of domains based precisely on the list of keywords that are in direct competition. By clicking on each keyword, you can find out the performance of the web pages you are analyzing, with an indication of the change in traffic from the previous crawl and an estimate of the traffic this kw is helping to bring to the page. To help you with the analysis, then, you can use the filter that selects keywords based on their current ranking or change the display setting (expand/reduce all, for an even faster overview).

Competitors on Keyword List

The last tool in the competition area is “Competitors on keyword list“, a tool that allows you to launch a comparison of up to five competitors from a list of keywords that you manually enter, which is useful for studying competitors from an angle, that is, based on a group of keywords you are working on.

After launching the analysis, the dashboard will recap some useful data for you, such as the number of domains under analysis, competing keywords, and “best domain” (the one that has the highest number of keywords placed in TOP10 on Google among those entered).

In the table below you immediately see the “Competitors on keyword list“, the list of domains that have been extrapolated by the suite as most relevant based on the list of keywords you entered: for each website you can read the Zoom Authority, Zoom Trust, Zoom Stability, Zoom Opportunity data, and then again the trend (i.e., the traffic trend compared to previous scan), Authority history, estimated monthly traffic, the amount of total keywords placed, and IP address. To take the analysis to an even deeper level, you can click on the hamburger menu and run one of the Domain Actions you have available here.

By switching tabs and going to Analyzed Keywords you can actually find out what the level of competition is between domains on the individual keywords you are interested in, with an indication of the URLs those sites are ranking with. For each URL you can see the SERP position, variation, and estimated traffic, but also continue the analysis with the URL Shares of the hamburger menu.

Editorial Tools

SEOZoom’s editorial tools section is designed to help you at every stage of writing content for your website.

In fact, with the use of the various tools offered, you will be able to manage an editorial plan for the online projects you are working on, find out the most relevant terms for a given topic, read the main news in your industry, perform an OnPage keyword analysis, and know the relevance of a keyword in the top ten ranked sites.

Let’s now go and take a look in detail at how the different tools work.

Editorial Plan Management

Even in the most modern approach to SEO, content remains a decisive aspect of achieving good search engine rankings, as Google never fails to remind us, regardless of the type of website: whether it is an eCommerce product sheet or a news article, the content must always try to meet the specific needs of users without going off the track of what is already appreciated and rewarded by the search engine.

Underlying everything, however, is a strategy – since you cannot think that articles should just be written – so you need targeted planning that also sets traffic goals to be achieved. In short, you need a real “editorial plan“, which identifies the strategy to be pursued, sets the goals to be achieved, and identifies the target audience you are trying to intercept.

The editorial plan is the backbone of the site and is based on the essentials of the online presence, exactly because it is the set of strategic actions aimed at achieving a goal that includes directions on “what, when and how” to publish content online in a strategic way.

SEOZoom’s Editorial Plan is a comprehensive tool that allows you to refine and make your content creation and management work more effective, since it allows you to create effective and strategic editorial plans and get a complete picture of the state of the work, fixing the gap that often exists between publishers and copywriters.

If you log in from the suite (Editorial Tools -> Editorial Plan Management) you will be able to reach the platform dedicated to Editors, where you can totally control the content of your site, and in particular:

  • Set up your editorial calendar effectively.
  • Write new SEO-oriented articles.
  • Enhance all editorial content on the site.
  • Discover article performance.
  • Commission articles to be written by internal or external copywriters, either by selecting an external copywriter from the “Available Copywriters” list on SEOZoom or by inviting one of your own team members via email.
  • Monitor the results of copywriters connected to the project.

At a glance, the dashboard offers key information about your site’s editorial plan, such as number of total articles (assigned and completed), those accepted (i.e., already reviewed and meeting the set goals), those assigned to external copywriters but not yet delivered, those on deadline, and so on. SEOZoom allows you to keep track of the performance of all the articles and categories you have set up, to monitor the keyword and traffic performance of the various articles, but also the performance of each individual copy making up your editorial team, to find out who gets the most efficient results and who better meets Google’s appreciation.

When you create a new article or edit one already in the list, then, you can set the strategic aspects of the content, set the main and secondary keywords on which to focus the text and add any notes, useful if you are assigning the article to a copy. The main feature of the Editorial Plan, however, is the ability to get an SEO analysis, based on the keyword you have set as the main one, that informs you in real time of the level of optimization you are achieving with your content and title and meta description snippets: specifically, you can check whether your article is in focus with what users and Google expect on the topic (the Search Intent), and whether you are effectively using relevant topics and keywords. In addition, from here you can also optimize titles and meta descriptions, possibly peeking at those used by sites placed in TOP10 on Google to be inspired by wording already rewarded by the search engine.

Thanks to the SEO Analysis – divided, as in the other parts of the suite, into the tabs of Optimizations – Topics – Keywords – FAQ and Correlated – SEOZoom can help you directly in the writing phase to limit errors and maximize the effectiveness of the text, accompanying you in every moment of the creative process and providing you with the right tools for SEO writing specific for each site and need.

No less useful is the dashboard specifically made for copywriters, which can be accessed from https://sz2020.seozoom.it/copywriter/login  (registration is free) and that offers the same tools just described but designed and tailored to precisely meet the needs of copywriters, who can thus use the insights and tools to manage the tasks received.

Again, in fact, the added value is represented by the Real-Time SEO Analysis, which leads the copywriter in his/her writing activity with the help of numerical scores, indications and text messages on SEO optimizations that can direct the writing to maximize performance.

At any given time, the copy can easily check whether he or she is adhering to these guidelines, which derive from both Google’s best-practices and SEOZoom’s experience in this field, with so to speak “objective” (or at least standard) technical advice on title length, meta description, and content, and more purely practical cues such as headings, image, and keywords management.

With SEOZoom’s Editorial Assistant, we have virtually automated all of the analysis and review part of planning and writing, so that you can always work on articles that are perfectly focused on the topic exactly as it is pleasing Google and search engine users.

Editorial Assistant

The Editorial Assistant is a full-featured editor that will assist you in content creation, bringing together text editing tools – also through the use of an advanced Artificial Intelligence system – SEO tips, and usage guidelines to adhere to when writing.

Before you start using it, however, it is important to make a basic premise related to the correct approach to this tool, which is based on an automatism and therefore should serve you, precisely, as an assistant in your content strategies. In other words, we recommend you to always put your own experience first when faced with choices, and not just mechanically follow the directions you find.

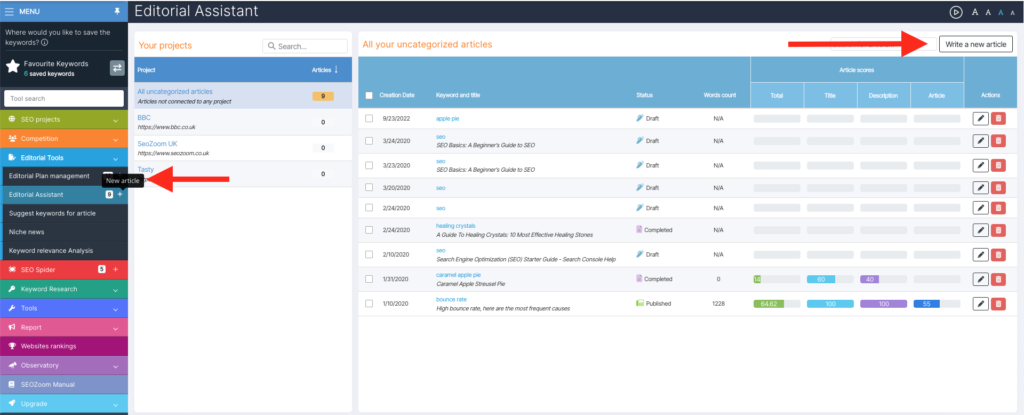
On the operational side, there are two ways to access the functions of the Editorial Assistant: clicking on the row in the Editorial Tools menu (where you will also find listed the total number of articles you may have already created) opens a dashboard that summarizes the work you have already completed, dividing the articles according to the relevant project and indicating, for each project, the basic information of the individual content: in particular, the screen shows the date the article was created, the main keyword, the title and status of the article (if it has been published, or if in draft) the number of words of the articles already written and some general information with respect to the total score that has been assigned by the SEOZoom editor, divided into scores for the title, for the description and for the copy part in the strict sense.

On the other hand, if you want to write a new piece of content, you will simply have to click on the + button that starts the creation of an article and follow the instructions on the page.

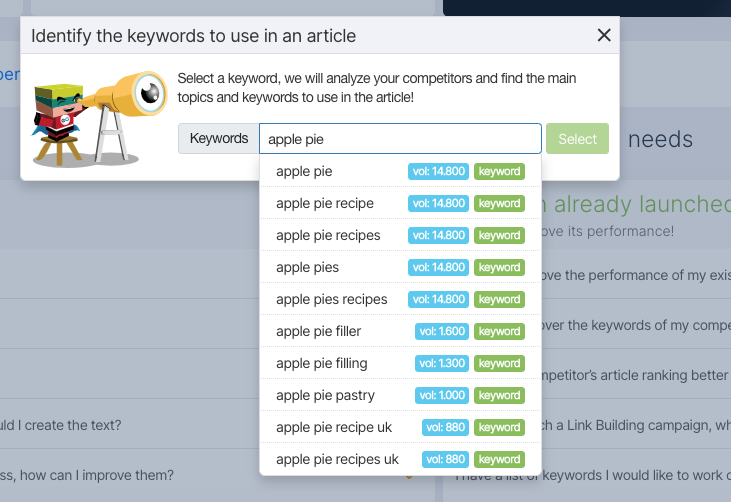
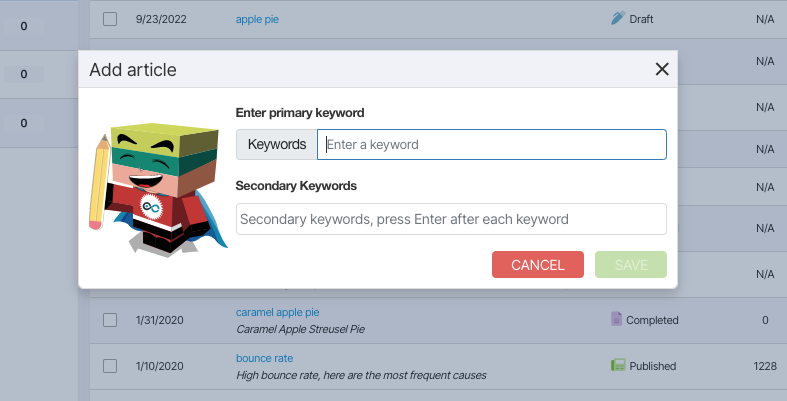
SEOZoom will ask you to enter the main keyword, which is the target keyword of the content, and the possible secondary keywords for which you would like to make the content rank. Filling in the secondary keywords box is optional and you can still do it at a later time.

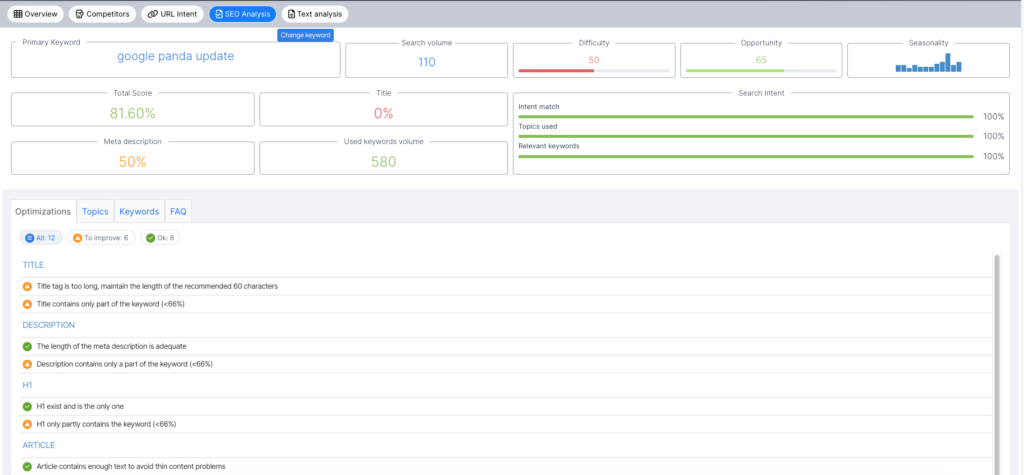
To help you write optimized content, the tool gives you scores divided by section: the goal is to try to achieve the highest possible score that meets all the SEO best practices in the optimization of a text, although (it is good to remember) there are many other elements that come into play when it comes to ranking.

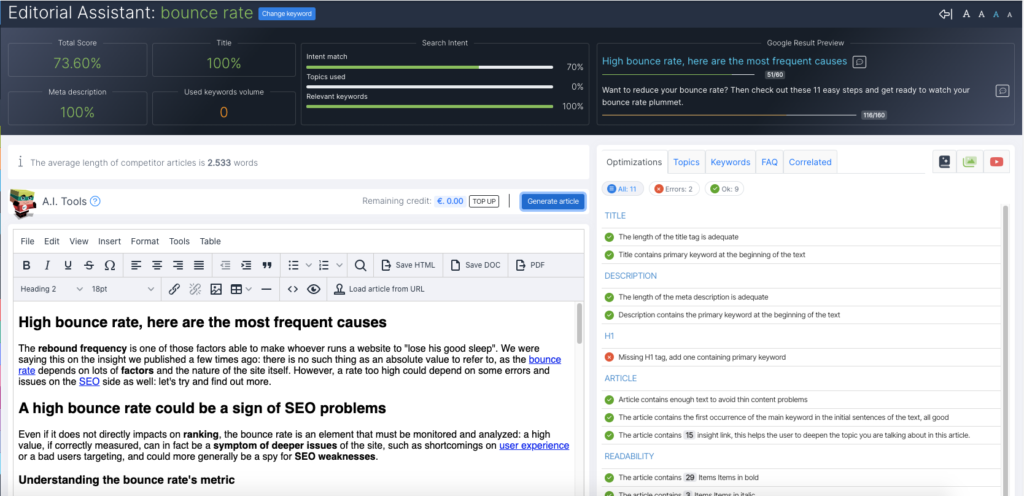
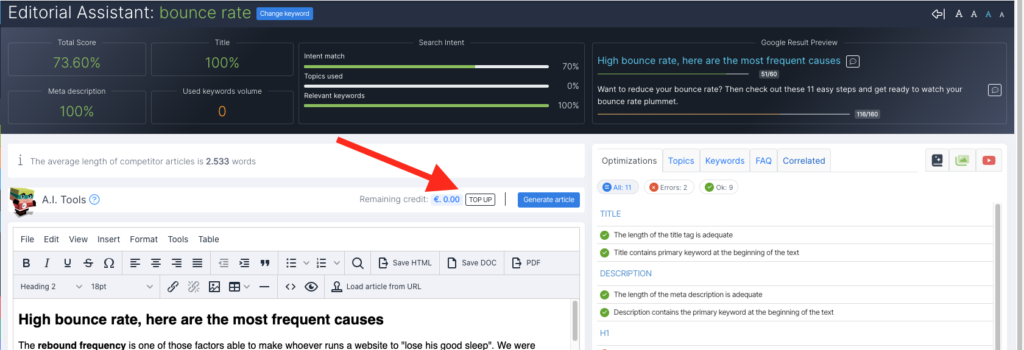
In the main dashboard, there are four boxes:

  • Total Score: an average of the scores of the various boxes.
  • Title: the score of the Title tag.
  • Meta Description: the score of the Meta Description tag.
  • Used Keywords volume: the total average volume, compared to the keywords that SEOZoom recognized in the content.

On the right side you find a first analysis of Search Intent, based on SEOZoom’s internal algorithm. The 3 boxes report the values of:

  • Intent Match: that is, how much in percentage the search intent was hit.
  • Topics Used: the percentage of related topics used in the article.
  • Relevant Keywords: the percentage of relevant keywords used that are correlated to the main keyword.

Once the first screen has been filled in, the suggested path begins with entering the title and description.

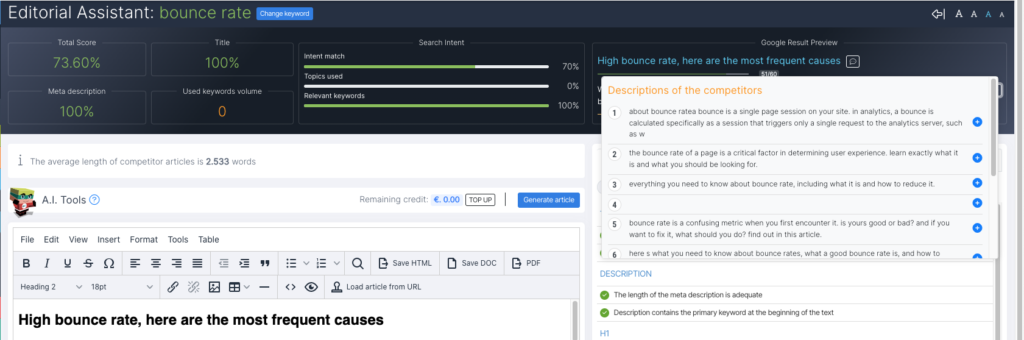
By clicking on the balloon icon, available for both Title and Meta Description, you can quickly check how the TOP10 Competitors in SERP handled the respective tag, and then try to draw some useful hints for filling in the two fields. Remember, however, that your snippets must stand out from the competitors in order to win clicks from the user: so, as you can easily guess, there is no point in mechanically copying a competitor’s text, but it could surely be useful as inspiration for the wording of your snippets.

The tool provides real time indications, which update right while we build the article.

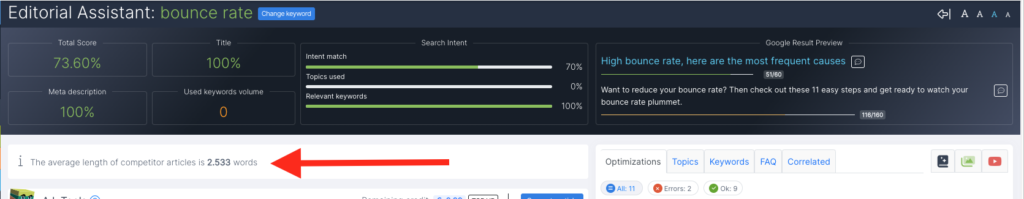
An example is the data about the average length of the content of competitors placed in TOP10, an indication that is not simply there to stand as a mere limitation (it does not mean that your content must compulsorily respect this length, also because Google does not use word count as a ranking factor), but as a reference of the fact that the user intent identified by Google requires a certain type of treatment and depth, to be considered when evaluating the composition of the content. Indeed, you must not forget that, in order for a piece of content to be considered as high quality, it must satisfy the reader’s need and meet Google’s criteria.

Scrolling further down the page, on the left you will find the actual editor screen, with the basic menu and all the standard icons that manage text formatting, including buttons to save the article in HTML, DOC or PDF format.

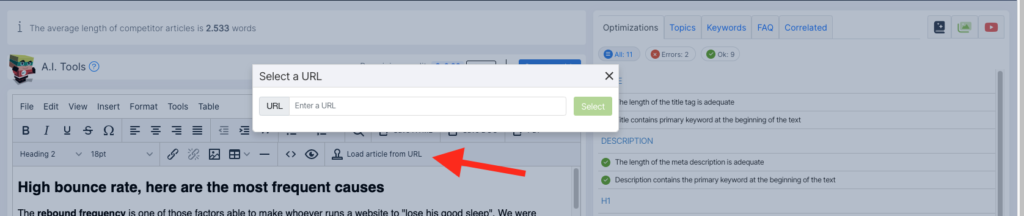
Moreover, there is a very interesting feature here: if you want to work on content that has already been published online (on your own site or on another domain), you can upload the URL by clicking on the dedicated button and SEOZoom will show you the text version of the content, which you can edit to your liking by following the analysis directions.

At the bottom of the editor, we find the automatic word count, a figure that as mentioned can serve you as a general reference, and then three buttons:

  • Article status (draft, completed, published): these are statuses related only to SEOZoom, because there is no automatic publication on your CMS at the moment.
  • Save Article: the button to save the work you have done so far.
  • Save in Editorial Plan: the option that allows you to save the current article in the Editorial Plan section.

From here you can also access the article Revisions, if any, and then view previous saves that you may need in some cases, such as, for instance, if you need to catch up on work previously done.

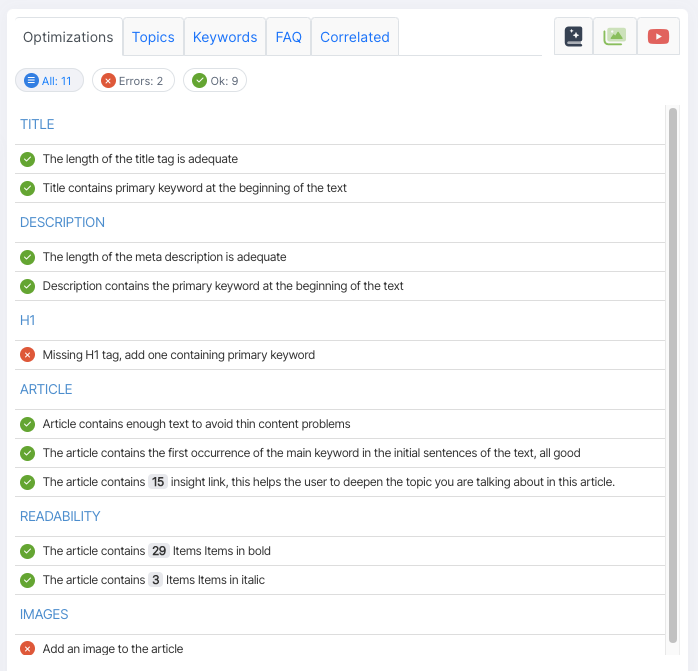
The most important parts of the tool are those found in the tables on the right, which perform a comprehensive analysis for building quality content, bringing back a number of suggestions divided into sections:

  • Optimizations
  • Topics
  • Keywords
  • FAQ
  • Correlated

while in the last three tabs you can directly access a database of:

  • Synonyms
  • Free images
  • Videos from YouTube

that you can consider including in your article to enrich the reader’s experience and better meet their needs.

In the Optimizations tab you have a summary table with points to consider in order to have a well-optimized article, based on the most widely used SEO best practices, separated into “errors”, “to improve” and “ok”. Of course, these are still “automatic” references and, depending on what you are writing, the goal you have in mind and your experience, some points might be more important than others while some aspects are simply to be ignored. However, having a checklist to follow could be a great place to start.

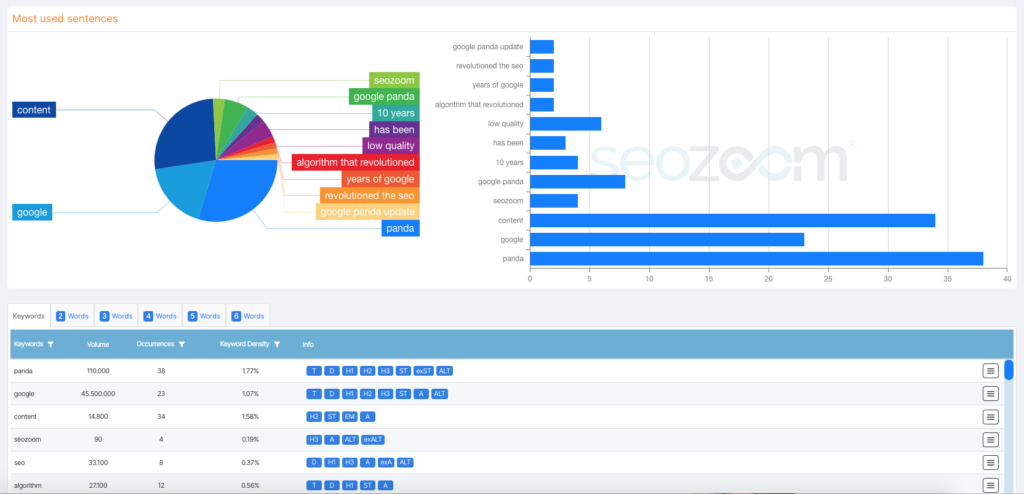
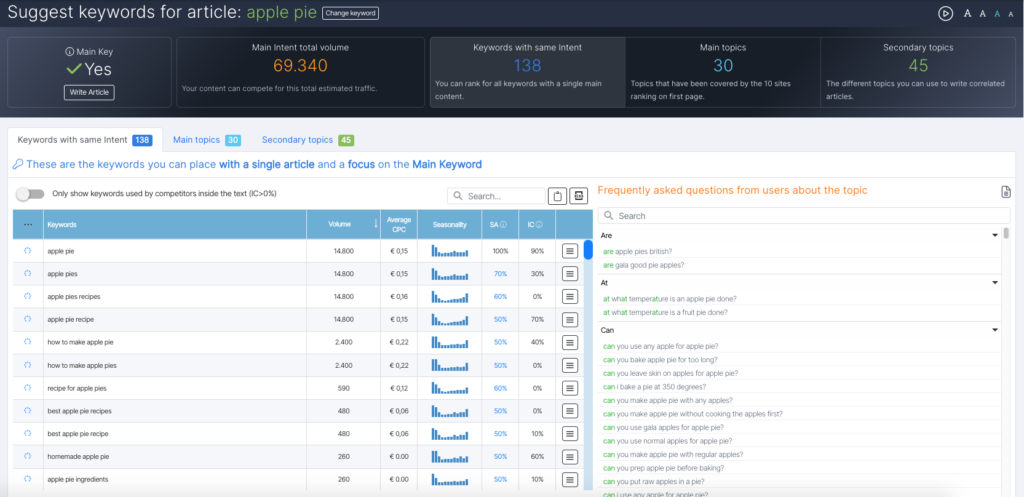
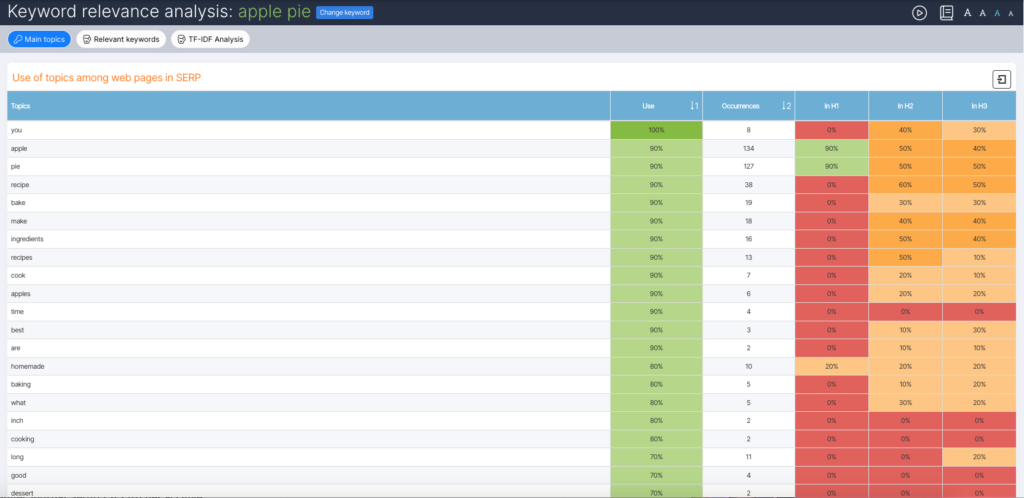
In the Topics tab you have an analysis regarding recurring topics related to your chosen keyword, which you should then use (or at least keep in mind) if you want to write comprehensive and relevant content on the topic. The next Keywords tab, on the other hand, focuses on keywords, flagging those that are potentially related to the target keyword you have entered: SEOZoom scans the SERP related to the keyword you have entered and identifies the other keywords on which the present competitors are currently positioned. In both cases, SEOZoom provides you with the average search volume and the level of relevance of the topic or keyword, highlighting how the competitors use this type of information (divided into All, Fundamental, Recommended, Optional, Additional, Missing) in the various elements of the page (topics, headings, sentences, images or anchor texts), in direct comparison with your content, to always provide you with all the tools to make your work more strategic.

More specifically, the difference between the various recommended keywords always relates to search intent: based on the word being analyzed, the various indications tend to suggest keywords that are recommended, essential to use or unnecessary, which based on your personal assessment you can add to the content or avoid. These elements are defined in relation to competitor analysis, and in practice:

  • unnecessary (useless) keywords are those that no one has used;
  • the optional ones are those that have a low average threshold of use;
  • the additional ones are those that some competitors have used and could perhaps be a plus to evaluate for your content.
  • the recommended ones are the ones used in most competitor content.
  • the fundamental ones are those that all placed competitors have worked on.
  • the missing ones are the ones that are missing in your text (compared to all the keywords).

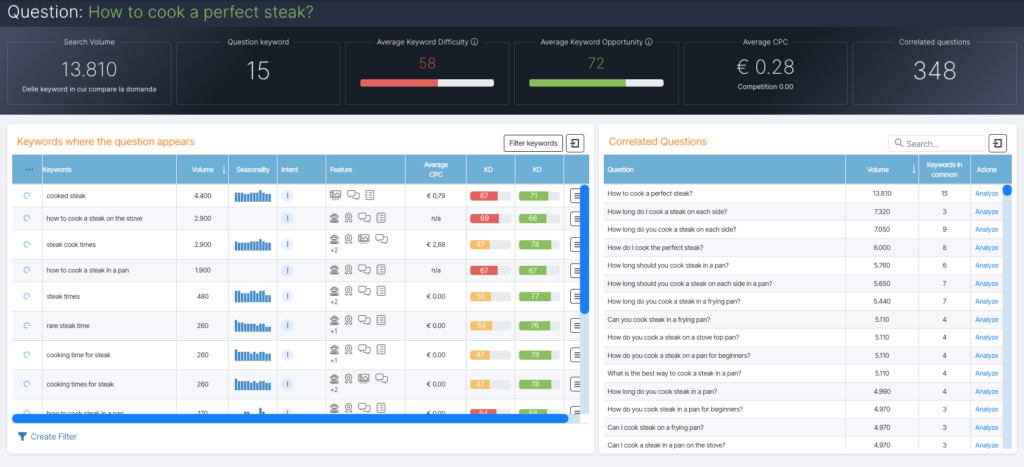
In the FAQ tab, SEOZoom brings you users’ frequently asked questions about the topic, collecting all the main questions that emerge within Google’s “people have also asked” panels, which can be useful informative insights to include in your content.

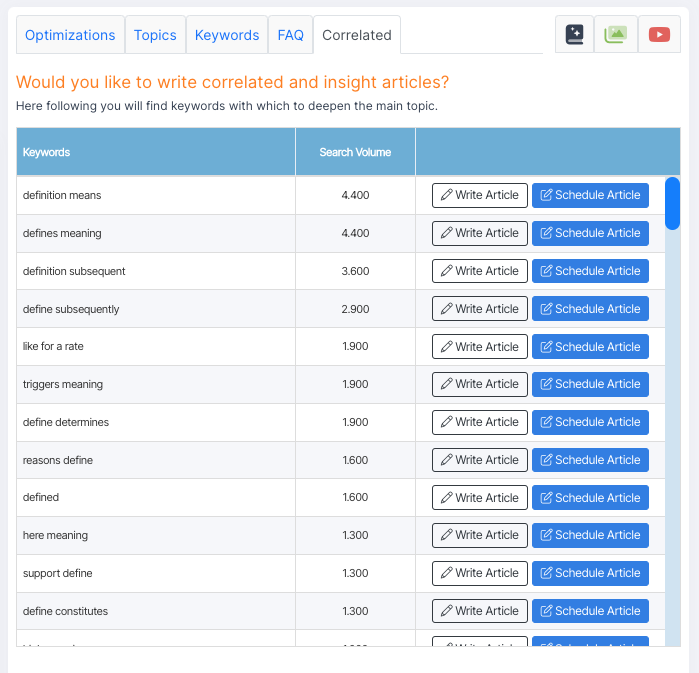
Lastly, in the Correlated tab you can see which keywords are not part of the main intent, but which can be useful for you to deepen the main topic with new content, to be linked with an appropriate internal link structure.

On this screen you also find three extra features, which allow you to refine your article.

  • Clicking on the dictionary icon, in particular, allows you to find suggested synonyms for any term, with the possibility of contextualizing the required meaning and delving deeper into the proposed term.
  • The photo icon, on the other hand, helps you choose free-use images to insert directly within our text, searching for those most relevant to the keyword or topic we are working on.
  • Similarly, the media player icon allows you to find videos from youtube to embed in your content, searching for those most appropriate and in topic.

AI for writing and proofreading: Ai Writer, AI Assistant, Generative Fill

But there’s more: SEOZoom is the only tool that enables its users to use the power of the most powerful AI systems on a ChatGPT-4 basis to support the creation of text optimized according to SEO best practices, thanks to the suite’s data, while also enabling more agile control over written quality and optimization opportunities.

In fact, as part of the introduction of the most advanced Artificial Intelligence technologies, SEOZoom has integrated three new tools within its Editorial Assistant: AI Writer, AI Assistant and Generative Filling, which represent a real enhancement for anyone involved in SEO-oriented content creation and beyond.

Before discovering how they work, a premise is necessary for us: we are convinced that AI is a very powerful tool for copywriters and content creators, but the human factor remains essential to offer truly relevant and valuable content for users. Therefore, we promote strategic and informed use of this technology, never without the necessary pre-publication review!

AI Writer is the only text generator that combines the power of AI with the accuracy and reliability of SEO data from SEOZoom! Basically, you have at your disposal an article generation function using Artificial Intelligence, capable of producing text similar to natural human language, with the added value provided by the suite’s data, which allows you to target your content toward satisfying users’ search intent.

Thanks to this tool, you can structure and provide an SEO-oriented canvas for artificial intelligence to launch text generation through an SEO analysis done in real time on the content of competitors already positioned in SERPs, so that you get text that contains the topics and keywords that Google – and users – consider a priority in relation to the topic you are going to write about.

Content creation starts with setting the target keyword and any secondary keywords you deem necessary to give depth to the article: in the text editor of the Editorial Assistant you can then click on the “Generate Article” button and choose how to proceed.


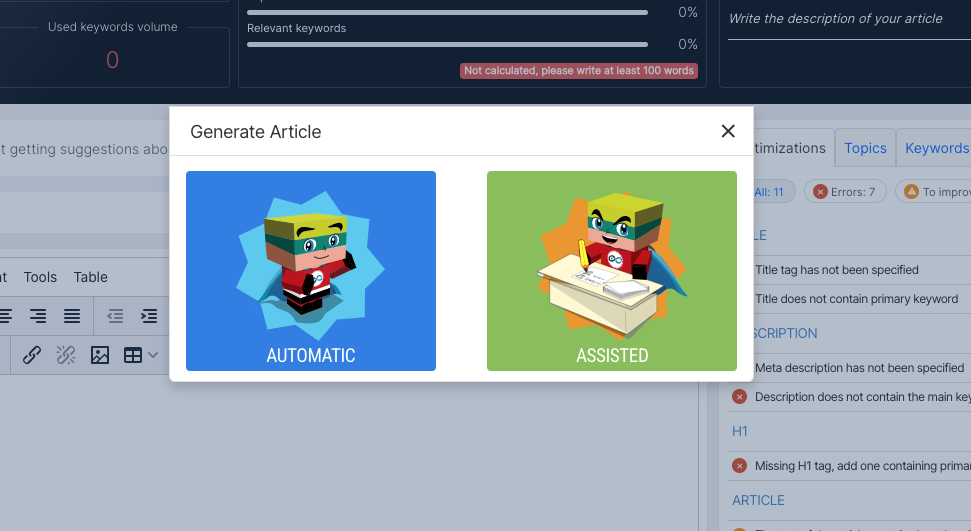
In fact, in front of you you have two options: to entrust the generation completely to the Artificial Intelligence, setting the variables that personalize the content and make it fit your needs, or to intervene personally to guide the AI in organizing the structure of the text, either by dragging the tags you are interested in from the lists on the right or by creating a new one.

In the latter case, you can proceed in a simple and intuitive way to decide how to compose the skeleton of the article, taking cues from the headings already used by competitors or from the frequently asked questions that users ask themselves on the web about the chosen topic, which will become the paragraphs of your new content; in addition, you can also start writing the text yourself, asking the AI to complete the work, or let everything happen automatically.

In either case, however, you can direct the writing to the type of site and style closest to your needs, through a simple menu. Among the settings you can vary are the choice of the tone of voice you deem most appropriate for the topic, the number of words per paragraph, the identification of the professional “figure” writing the content, and the type of site, which serve precisely to refine the prompt for Artificial Intelligence.

The system is so advanced that it avoids the risk of “duplication”: in fact, even if you enter the same keywords and topics, the AI always manages to provide different texts, while still respecting the input settings.

This feature has a pay-as-you-go cost mechanism : each article has a variable price depending on the amount of paragraphs set and the number of words provided; on average, the cost of an article starts at about 0.50 cents and goes up, and in any case when you create the article structure there is a preview of the maximum price you will be able to pay. The cost of the article is deducted from your “AI feature credit”, which you can recharge quickly and easily by clicking on the box in this section (selecting the denomination of the recharge and the preferred payment method, between credit cards or PayPal).

The automatic text generation tool has exceptional practical value, because it allows you to create already SEO-oriented articles in no time and on any topic, and is therefore a valuable support for finding insights on topics you do not know or master perfectly, or for starting a work to which you can then add the “human factor.”

However, we would like to reiterate that text generation should be used responsibly: this information generated by an A.I. is an excellent starting point to be able to speed up the work of writing texts, but we strongly advise against publishing on websites an autogenerated text without any human revision intervention. In short, A.I. is a very powerful and revolutionary tool, but it is still a tool and should be used as such.

AI Assistant, integrated into the Editorial Assistant tabs, is the perfect tool for those seeking constant analytical support during text editing. Through an advanced analytics system, this assistant offers you real-time analysis of the various sections of your article, not just suggesting SEO-based interventions, but making an in-depth evaluation of different components of the text and providing targeted recommendations that can be applied instantly.

The goal of AI Assistant is to enable you to refine your content so that it is not only optimized for search engines, but also consistent, readable, and engaging for your target audience.

AI Assistant examines and analyzes a number of factors critical to the quality and effectiveness of a piece of content, which we have broken down into macro-categories for clarity. Not all recommendations need to be followed to the letter, but they are designed to offer you flexible support during writing or revision, taking into account the SEO goals and stylistic preferences of the copywriter.

Broadly speaking, we can identify five major areas of revision:

  1. SEO analysis and relevance to search intent
  2. Analysis of text quality and structure
  3. Analysis of accuracy and style
  4. Analysis of creativity and engagement
  5. Analysis of readability and usability

AI Assistant is thus a comprehensive and versatile tool, fully integrated into the SEOZoom ecosystem, capable of analyzing every crucial aspect of writing, from SEO relevance to stylistic quality to reader engagement. It stands out for its ability to provide detailed analysis and concrete suggestions, so that you can quickly make informed decisions and improve your text not only for search engines, but also to provide an optimal end-user experience.

AI Assistant is based on a pay-as-you-go system with a base cost of €0.20 per activated analysis. Once the first evaluation is completed, you can use the tool for revisions at no additional cost.

An important feature of AI Assistant is its support for managing multilingual content: in fact, the tool can automatically recognize the language in which the text is written and provide you with contextual suggestions without altering its integrity. This is particularly useful if you work in multilingual contexts, because it allows you to revise and optimize content written in various languages, maintaining consistency and effectiveness even in international markets.

Generative Fill is another innovative tool designed to help you when you are looking for a dynamic and creative solution to generate real-time content directly within the editor. With this feature, you can select portions of existing text or start from scratch to ask artificial intelligence to rewrite sections of the content, generate stronger titles, paragraphs or descriptions, improve the structure and summary of a portion of the text, and insert specific keywords to improve the SEO of the selected paragraph.

The important advantage of this tool is that you can provide custom inputs, allowing the AI not only to rewrite, but to adapt the content according to your specific needs, whether it is an article for a blog or a description for an ecommerce site.

In addition, you will be able to launch your inputs using both text and voice commands-just input via typed text or provide voice instructions using a microphone to get the required action on the content, making the workflow even faster and more flexible. And without ever leaving the Editorial Assistant editing page!

Generative Fill also adopts the pay-as-you-go system based on the number and complexity of operations required, with the assurance of always having a cost estimate before the operation is confirmed.

In addition to text generation, Generative Fill allows you to add new AI-created images directly from the editor, based on the custom descriptions you enter. By selecting the orientation, resolution, and image specifications (including the subject), you can view and insert automatically generated images into your content, saving you time searching for visual resources.

All of these features are seamlessly integrated with SEOZoom’s SEO infrastructure, keeping the focus on SEO relevance and achieving ranking goals.

Always remember, however, to use artificial intelligence tools as a support to human work, and not as a substitute. The tools offered by SEOZoom can shorten revision and drafting time, but it is always essential to review the generated texts to ensure the highest level of quality and avoid errors that could compromise the final result.

Suggest Keywords for Article

Still from the Editorial Tools menu you can access Suggest Keywords for Article, a tool that allows you to optimize the creation of a content thanks to an in-depth analysis of the target keyword, which identifies the search intent and all the information that may be relevant to increase your chances of ranking.

As you will see, the features present are similar to those found in the Analyze Keyword tool, but in this feature they are isolated and made available for more targeted analysis.

To start the analysis you just have to enter a keyword in the box and select it from the drop-down menu.

The first information that the tool presents you with is whether the keyword you have chosen is actually the main kw, the main keyword of the search intent, or whether it is not (and then proceed accordingly, based on your evaluations and strategy).

In the next four boxes we find very important information that will then be explored more in the individual tables on the page.

  • Main Intent Total Volume

The total search volume for which we could compete with a single article focused on the main keyword.

  • Keywords with Same Intent

The number of similar secondary keywords that fall within the same search intent as the main keyword – which also tells you, by extension, that if you can create effective, accurate, in-depth text you may in fact intercept other keywords that have the same intent. Click to view the full related table.

  • Main Topics

The number of relevant terms identified by analyzing all the topics covered by competitors positioned in the top 10 positions on Google, which therefore represent important focuses to be considered in the article. Click through to view the related table.

  • Secondary topics

All the keywords that are not closely related to the focus currently identified in SERP, and therefore not worth including in the main article but in additional content. By clicking on the box, the display switches directly to the related table.

As mentioned, the tables here allow you to examine keyword and topic information in greater detail and precision. Briefly:

  • Keyword with the Same Intent lists the keywords you can position with a single article that has a focus on the Main Keyword. For each keyword you can read the volume, average CPC, seasonality, and the two SERP metrics Affinity and In Content, as well as launch Keyword Actions from the hamburger menu. By setting the filter at the top, you can also turn on the display limited only to keywords used by competitors in the text (i.e., with IC value greater than 0) and read users’ Frequently Asked Questions about the topic, which can become tips you can leverage for content creation.
  • Main Topics reports precisely what are the main topics to be covered in the content of the web page: based on the analysis of the articles placed for the selected keyword, SEOZoom shows you the relevant terms that have been encountered in most of the texts that are getting the best results on Google. On the left-hand side you can then see the list of topics related to the relevant term you are analyzing and, in the right-hand column, all the related keywords: this data is useful in the organization and structuring phase of the text, because it can help you manage the paragraph part and understand how to focus and organize your keywords to make content that is as in-depth and useful as possible for users. Again, for each topic and keyword there is specific information, such as percentage of SA or IC, as well as search volume, average CPC and seasonality.
  • Secondary topics, on the other hand, brings you terms pertaining to topics related to that of the main keyword, which, however, would be more useful to intercept with an in-depth article separate from the current one. For each topic you find the potential traffic volume, the number of keywords related to the same intent, and the potential volume of the article (based on the total number of keywords that can potentially be intercepted), and you also have the option of launching Keyword Analysis.

Niche News

Niche News is the right tool to find insights and ideas when making a topical article, as it allows you to discover the most talked about topics in a specific industry and easily locate all the most popular topics being talked about on the web right now.

To start scanning you can browse through the proposed sectors or use the free search for uncategorized news: all the results you get come directly from Google News, and for each category you can also divide the data on a time basis, with tabs that group news items into “Breaking news”, “Today”, “3 days ago”, and “a week ago”, as well as “All” for global viewing.

By selecting the “Cellphones” sector, for example, you can see an overview of the topics that all the major sites cover or have covered in the period you are interested in, and on the right you can check the most recurring terms in the chosen sector.

This function thus allows you to learn about even very current topics and to keep up with the “trending topics” that are affecting the Web, even in real or near real time.

Keyword Relevance Analysis

Keyword Relevance Analysis is the last tool you find in the “Editorial Tools” menu and it helps you deepen your study of the keyword you want to work on for your content.

Starting with the entry of a keyword, in fact, the tool analyzes the competitors in Google’s TOP10 and helps you understand how relevant the use of each word was within the text and what other terms are relevant to the topic.

To begin, enter the keyword you are interested in examining in the box at the top and start the analysis.

After a few seconds you will see a dashboard that presents three tables: main topics, relevant keywords, and TF-IDF analysis.

  • Main Topics, like the similar tool in Analyze Keyword, shows you all the topics relevant to your chosen one, with various usage statistics. In particular, you can see: the percentage of top ten competitors who have used these terms (100% stands for 10 out of 10 competitors, 70% means 7 out of 10, and so on), the average number of occurrences of the keyword in their texts, the percentage of top ten competitors who have used these specific terms in the H1, H2 and H3 elements. Thanks to the color code ranging from red to green, with gradations in between, it will be easy for you to tell at a glance whether the term has been little, a lot or not at all used and, consequently, which terms are therefore the most relevant in SERP for your source keyword and which ones have less centrality.
  • Relevant Keywords performs a similar analysis, focusing, however, on keywords that have the same intent as the one you entered: in this case, the table allows you to quickly see the search volume of the individual keyword and, more importantly, the percentage data on its use within the content of the competitors present in TOP10 on Google. To be precise, you can find out the level of usage in text, in H1, H2 and H3 headings, in anchor text for links, in Alt text of images or with character emphasis tags (bold and italic).
  • TF-IDF analysis refers precisely to the statistics of the Term Frequency – Inverse Document Frequency algorithm, which is used to determine the mere relevance of a text in relation to the terms of a search query through a purely textual analysis of documents in SERP. This information can help you understand the value and relevance of certain terms with respect to the keyword you are interested in, although we should not look for a direct causal relationship between the data and ranking.

To understand how the TF-IDF function works you can see the screenshot that appears by entering “Apple Pie” as a relevant term and setting a relevance threshold of 6 (default value: it means that keyword data must be present on at least 6 out of 10 results in TOP10); in addition, you can also manually add your own related topic URL to compare the statistics against better-ranked competitors on Google.

On the left you find a list of the pages that make up Google’s TOP10 for the keyword, while in the table on the right you have information for each keyword reported as relevant: average keyword density, kw density suggested by the TF-IDF algorithm, and individual keyword density for each of the results in TOP10. Red-colored cells report values that deviate above or below the average value, while green cells present data that are close to the average value.

You can sort each column in ascending/descending order and eliminate any terms that are not useful to you, so that you have easy and complete access to the data you really need.

With this tool, we are not suggesting that you consider keyword density in the creation of your content or focus your work to comply precisely with the algorithm’s directions: as always, data must be interpreted, and in this case it can be useful to analyze the context of the keyword and understand how specific terms were used and how much weight they have within the various pages positioned on Google, so as to compose an overall analysis – with relevant keywords and main topics – that will help you refine and make your content more competitive.

A.I. Tools

In this section you will find 37 specific tools to lead you in the creation and management of all kinds of content to be published online, for any type of site, solving small daily problems and snags of the writing activity thanks to Artificial Intelligence.

Each of these tools performs a small task that is useful for copywriting: from simple spell-checking to generating concept maps and semantic maps, from cues on topics you are not thoroughly familiar with to identifying topics and keywords relevant to the chosen topic, to creating category texts, product sheets, product descriptions and whole sentences.

All powered by Artificial Intelligence, which allows you to speed up the information-gathering phase and devote yourself to writing without delay or hindrance. That is, you can delegate to the AI most of the routine tasks of the ideation and text-writing activity, getting with a few clicks and a few cents ideas, insights and guidance on the topics you are working on, even if you do not fully master the topic or have doubts and difficulties on how to set the content.

But there’s more. AI Tools also helps you generate content for you can use on social, to simplify and speed up the work of those in charge of communication on the various platforms, which requires versatility, adaptability and time.

Specifically, the “Post for…” set of tools allows you to create perfect copy for each individual social platform-Facebook, LinkedIn, Instagram, Tiktok, X, Threads: you only need to enter a source text (a news story, an article, a photo description) to get in response an AI-generated post, written tailored to the platform you have chosen, both in length and in the method of communication.

“Scripts for video,” on the other hand, helps you in creating text to be read on video. In this case, you have to enter the source content (even very meaty articles) and specify the characteristics to be respected in the script, such as duration, number of expected speakers, and tone of voice. The AI will quickly create a script that is perfectly optimized for the most salient times and topics.

All tools are powered by Artificial Intelligence currently based on GPT-4, driven by prompts tailored to the needs of content creators. The disclaimer already launched for the automatic text generation feature applies: the information in the outputs is generated directly by the AI and, in some cases, may not be precise, accurate, or up-to-date (also due to “latency” of the AI system), and therefore always needs a human-side revisionary check, to avoid affecting the quality of the content you then intend to use on the site.

These tools also have an extra usage-based cost compared to the subscription to the suite: specifically, we are talking about a negligible price, in the order of a few cents (0.00082 cents per word generated in output), with the possibility of recharging your credit quickly and easily.

In addition to the classic suite, you will also find AI Tools at the copywriters’ version of the Editorial Plan: you can access the dashboard here https://sz2020.seozoom.it/copywriter/.

The 37 tools can serve any type of site and content and are divided into six macro-categories:

  1. Copywriter
  2. Grammar
  3. SEO Tools
  4. Social
  5. e-Commerce

Some tools in the e-Commerce section also make batch generation mode available to help you speed up and simplify work on a large set of pages or keywords. By uploading a CSV file with the elements you need, where each row corresponds to a different content, AI produces results in bulk. At the end of the process, the output will be available as a CSV file in the Batch Operations section. This mode has a reduced cost compared to single operations, and the generated content will be made available within 24 hours.

Still not enough? If you can think of a different function that would be useful for your specific needs, you can ask us to see if it can be added to the tools, if it is compatible with the technology, of course.

SEO Spider

The spider is a tool that scans through internal links of sites, subfolders or URLs to check a series of technical parameters “invisible” to the naked eye that describe the structural characteristics of the domain and highlight errors and warnings, flaws to be fixed, more or less serious problems, anomalies and obstacles that can hinder the site’s performance in Google Search.

Specifically, SEOZoom’s spider is a comprehensive tool for detecting structure errors, checking the HTTP status code of pages and resources, checking that meta tags, attributes and directives are correctly set, to avoid issues that can complicate Googlebot crawling, waste crawl budget or even prevent URL indexing on Google. In addition, thanks to the integration with the other tools in the suite, you can get information about each crawled URL, immediately displaying the number of keywords, traffic and other strategic details.

It is a complex tool: it offers data and analysis that you need to interpret carefully, but it is also the means to take a step forward and really be able to improve your website.

You can start the scan from Project or directly from the section in the side menu, through the Create a new Scan button; the number of scans available for each account depends on the type of SEOZoom plan you have subscribed to, while there are no limits to the start of scans, so you can also start the same scan multiple times.

In the window that opens you will have to indicate the name to be given to the scan, decide the extension (whether or not to restrict the analysis to the folder entered) and set the URL from which to generate the analysis (usually, the domain as it is indexed, with a focus on the protocol), and possibly indicate a pattern to be excluded from the scan

On the technical side, you can also set three different aspects:

  • Courtesy level: after how many seconds the spider should scan the pages of the entered site. If set to one, the spider will scan your site every second.
  • Scan depth: set the maximum level of click distance from the home page at which the spider will track pages. The value entered stops the scanning when a page reaches precisely that number of clicks from the home page.
  • Pages to scan: the maximum number of pages the spider can scan, which also refers to the limit resulting from your subscription plan.

If you have subscribed to a Business and Corporate plan, you can manage another option, which relates to websites that use javascript frameworks such as React or Angular, by clicking on “Enable Javascript rendering” for a scan capable of scanning these elements as well.

Once the crawl is started, SEO Spider begins browsing the indicated site, subfolder, or URL, and the status updates you in real time on the level of completion, going from not started to queued, then crawling, and finally finished.

At this point, when the crawl is finished, SEOZoom provides you with an analysis highlighting anomalies and errors detected, broken down by tab, with a complete list of URLs analyzed and their values.

But how can you use all this information and, more importantly, do you have to worry if the Spider finds so many errors and warnings in your site? From our point of view, the approach to SEO Spider must start from the assumption that the alerts, Warnings and Errors, are all technical items related to the Spider’s settings: therefore, it is good to analyze the individual sections to unearth errors and fix them, but to this you have to put side by side a broad and conscious view of the technical aspects, because not all items are a “problem” and have the same weight. For example, and just quickly, a crucial page on your site which indexing you have inadvertently blocked via robots is definitely an error, while the absence of an alt text or duplicate H2 are minor items that should not impact your ranking (or, at least, not directly and so clearly).

And so, to have a perfect site it is definitely good to limit the number of Spider alerts, but you do not necessarily need to aim for absolute zero!

Keyword Research

The “Keyword Research” section groups several tools that allow you to perform a strategic keyword research, taking into consideration various and particular aspects to evaluate keywords.

Specifically, the menu allows you to use:

  • Site Builder
  • Your keyword researches
  • Keyword Infinity
  • Topic Explorer
  • Interest Finder
  • Discover Keywords
  • Niche Investigation

Let’s analyze each tool individually!

Site Builder

Site Builder is the ideal tool if you want to quickly and easily create the structure of websites, while also displaying a prior estimate of the actual traffic each section could get to optimize your evaluations.

To start building your site, you must first create the main node of the structure: the basic name is “Homepage”, but you can change it to your liking.

From here, using the “Add” button, you can insert the main branches of your website, which are represented in this case by “Categories”. You can enrich each node of the structure with a list of secondary keywords, which can also give you an idea of the potential volume of the section you are developing.

Under each category, you can enter the titles of the articles and, for each title, add the secondary keywords, again referring to the entry box located in the upper right corner.

With the buttons found in the horizontal bar, on the other hand, you can center your tree diagram, shrink it or expand it to get the best view for you.

When you are done, click on Save Project and Export to download the project as an image file (svg or png extension), as a pdf, as a compressed zip folder, or a WordPress-specific import file format.

After downloading the file, log in to your domain and…upload the file. Your structure will be imported directly into the domain, with all articles ready in draft and accompanied by the keyword set, so you (or your copywriter) can have a constant reference when writing the related text.

The site builder is useful for understanding the potential of a project from the very beginning, such as structuring a blog while already having a clear idea of the kind of volume each article and each branch of your tree might get.

We recommend that you use the site builder to design your sites, but only use the import file on websites that are still empty.

Your Keyword Researches

This feature allows you to create and control lists of keywords saved in the course of your analysis, which can later come in handy when writing your articles, for example. Basically, it is the place where you can group and organize the keywords you have “discovered” to keep them ready for use when the time comes.

To start using the tool, click on “New Keyword Research” and enter a name and brief description.

After this first step, you can create one or more groups that will identify a subset of keywords. To enter new keywords into your group you can use the panel on the right linked to Keyword Infinity, but you can also enter keywords into this section from any area of the suite via insertion mode, which allows you to set the default addition of keywords “into a keyword research.”

That is, the basket in the upper left corner:

The tool allows you to deepen the analysis for each keyword research you have saved, which you can find in “research list”. By clicking edit you have access to the detail of the individual research, which presents you with a range of useful data for your content production strategy.

Specifically, the first dashboard summarizes in a few boxes the most relevant information of the keywords you have grouped, such as total number, monthly search volume, total CPC and average CPC, but also seasonality-dependent variations, which allow you to check if the expected traffic undergoes important variations at specific times of the year and when (by clicking on the “info” icon to go into more detail), so to help you in your evaluations on the timing of content publication.

Then at the bottom you will find two tables: on the left is the list of relevant terms with quick indication of relevant keywords and potential search volumes for the group, while on the right is then the detail of specific keywords. Here you can specifically see the search volume and average CPC of each keyword, and launch Keyword Actions to study the term more analytically.

At this point, you can decide to plan an article that includes the group of keywords you have analyzed and selected as strategic, or add the list of keywords to the monitored keywords in a new or existing project. If you want even more practicfal help, you can click on the “Suggest Editorial Plan” button that appears at the top of the tables: SEOZoom performs an analysis based on the keyword grouping under consideration and suggests how many and which articles you need to be in line with the focus and user intent Google is currently rewarding. Specifically, the tool clusters main intent and related secondary keywords, reporting for each article what the potential traffic and Affinity values are.

SEOZoom’s suggested editorial plan processes the keywords you enter in the keyword research and prevents you from writing “superfluous” articles focused on keywords that do not represent main keywords, and thus should flow into more in-depth content that could intercept more keywords. For each article there is a link that takes you to the Suggest Keyword Article tool, which can help you refine your search.

Keyword Infinity

Keyword Infinity is our main tool for analyzing correlated keywords: it is a real database that is constantly being updated and features an incredible number of keywords. In addition, if you happen to enter a keyword that does not appear to be within the database yet, a specific engine dedicated to this task will expand the scan and show new keywords in about 10 minutes.

To use the tool, enter a keyword in the top bar, set the terms to be contained or excluded in the search, and start the search: a double table will appear, which on the left presents you with query groups, in each of which you will find the keyword you entered, declined in all possible variants. 

On the right, on the other hand, you can delve into the information about the individual keyword, which you can also possibly include in the saved lists simply by clicking on the + button, as in the other parts of the suite.

This table gives a complete overview of the keywords, of which you can read about the main type of search intent, any SERP Features they trigger, search volume, Competition, average CPC, and a chart indicating the seasonal search trend, while the hamburger menu takes you to the possible Keyword Actions.

Immediately above the tables you can access the different areas into which the crawl is divided and, in particular, see the part about search intent, with the different tabs (where available) divided into Informational Keywords, Transactional Keywords, Keyword Graph, Knowledge Search, which allow you to refine your analysis even more.

Inside Informational Keywords, the tool groups all keywords that are inherent to an informational intent, thus requiring content that meets the informational needs of the user making a query on the search engine.

Inside Transactional Keywords, on the other hand, you find the list of keywords that specifically refer to a transactional intent, and thus to a user interested in buying a product or service, or otherwise ready to take an action (transaction) on a web page.

In the Keyword Graph there is a graphical or tabular representation of the keywords, with direct information on the average volumes of queries used by users with respect to the most important questions. Through the menu you can also access the graph based on prepositions and actions related to the keyword you are examining.

Lastly, with the Knowledge Search tool, you initiate a search on the recognized entities of the semantic web for the entered keyword, based on the entities that similarly appear in Google’s Knowledge Graph, which is also useful for checking which entities are actually present and indexed in the semantic web.

Question Explorer

Question Explorer is an innovative tool that allows you to find all the questions that users have in mind and search for on Google when they need to solve a real problem.

This new feature basically succeeds in searching for questions that are shown in Google SERPs and revealing all the keywords that Google’s algorithms consider relevant and useful to satisfy the user’s search need.

The interface of the feature traces that of Keyword Infinity: just enter words or entire sentences that make up the query you have in mind to analyze and launch the scan. To refine the search, then, you can also exclude certain terms, so you can limit the focus to the industry and niche type in which you operate and are interested.

On the next screen, SEOZoom then shows you the full list of keywords in which the query appears, i.e., the queries that trigger the “People also ask” box in Google’s SERP in which there is precisely (also) the relevant query, as well as a range of information about the entire group of keywords and individual keywords.

In particular, you can immediately see the total number of keywords related to the query, the overall volume of searches generated by these keywords, the average Keyword Difficulty, Keyword Opportunity and average CPC values, which help you get a first overview of the level of competition you can expect on the entire cluster.

Looking at the table, on the other hand, you can discover the detailed information about the individual keywords, with indications of precise search volume, level of seasonality, but also main type of intent and presence of any features in SERPs, so that you have all the information you need to write content aligned with the real needs of people and Google.

Interest Finder

With this feature you can discover strategic keyword groups for your site and best capture specific aspects of a central topic on which users’ greatest interest is focused.

Clicking “Analyze” starts a new search that has the selected keyword as the main cell; if data is present, you can progressively continue to search for new long-tail keywords.

Thanks to this cell visualization, SEOZoom offers you groups of long-tail keywords grouped by similar topic, with the aggregate search volume data.

By selecting a cell, you can analyze all afferent terms and find out the detail of individual keywords, showing monthly search volumes and Keyword Actions for deeper analysis.

If you click on the “plus” symbol, you can enter the keyword in a project, a keyword research, or among your favorites, depending on which insertion mode is active at that time. Before using this feature, therefore, please remember to check which destination you have set for your keywords.

From a strategic perspective, with this keyword research tool you can intuitively identify high search volume long tails to define your website’s editorial planning, intercept content on which to focus the writing of well-perfoming texts, and discover keywords that your target audience’s interest is focused on.

Topic Explorer

This tool allows you to discover the list of keywords that have the same search intention, and thus to view the terms that are related to the specific need that prompted the user to do a Google search, and other useful information for your strategy, such as the main topics related to the keyword and different elements to study ranking opportunities.

To discover keywords that have the same search intent, simply enter a main term in the box and start the analysis.

On the left side of the dashboard you will find the list of main topics related to the starting keyword, grouped on specific relevant terms: for each grouping you can quickly read the overall search volume values, average CPC and average KD.

By clicking on a grouping, you activate the display of the related information in detail in the table on the left, which then lets you analyze all keywords by specific topic, as well as consult our usual data on elements such as KD and KO, average CPC, estimated monthly volume and seasonality, which you can use to carry out an effective keyword research along with the additional Keyword Actions of the hamburger menu. In addition, you can sort the charts by the value of Search Volume (VOL), CPC or Keyword Difficulty, or change the view to set up a list view.

Clicking on the Graph tab, on the other hand, allows you to access a graphical view of the information, which visually walks you through understanding the hierarchical relationship between terms and topics also based on the relevance or weight of each individual node.

Discover Keywords

The Discover Keywords tool, found within the Keyword Research section, presents you with suggestions on related long tail keywords searched on Google and YouTube.

To start the analysis, simply enter the starting keyword in the box, click on Analyze, and wait a few seconds: the system will continue its research until you click on “Stop“.

The report generates a cell graph, and each cell in turn contains additional long tail keywords and related terms to the main word you entered. By hovering your mouse over a cell you can “navigate” it and go find new keywords.

Double-clicking on a cell displays the keywords within it, as the example screenshot shows:

Using the box on the left you can also refine your search, setting keywords to exclude from the analysis and those to consider instead, and then export the terms you are interested in using the dark gray export button.

This tool is multilingual, so you can search both Google’s UK version and SEOZoom’s other international databases; in addition, you can also focus your analysis on Youtube, so you can quickly acquire valuable information to understand what users on each specific platform are actually searching for.

Niche investigation

Niche investigation is the tool that helps you to analyze a target niche, study the sites present, find out what are the most interesting keywords in that niche and, therefore, get insights to improve your website by unearthing new high-profitable keywords that have interesting volumes but few indexed (or poorly optimized) results.

The tool is divided into three different analysis modes.

The first tab, “Keyword Research“, allows you to get a complete keyword research for each sector identified by SEOZoom: just search from the list for the category you are interested in, the one that is the closest to the topics covered on your site, click and wait for SEOZoom’s automatic analysis, which will quickly show you a list of keywords related to the chosen sector, identified by scanning the reference sites of the niche. For each keyword you can read estimated search volume, intent type, features activated in SERP, average CPC, seasonal search trend, Keyword Difficulty and Keyword Opportunity, and total indexed results. The table shows the complete list of sectorial keywords (which can be up to several thousand!), so it is crucial to use the filters and column sortings to make the information more useful and usable. By clicking on the “Questions” tab, on the other hand, you can view users’ frequently asked questions with respect to the selected niche, with an indication of the impressions generated by each question.

The second mode of analysis is “Spy on Competitors” which allows you to get a list of strategic keywords from the domain you manually enter that you think is a good reference for the industry of interest. Basically, SEOZoom scans the site you have decided to spy on, analyzes its competitors, and provides you with a list of keywords related to the niche it belongs to, which will be useful in your strategic evaluations.

When the scan is complete, SEOZoom shows you a table with all the site’s ranked keywords, with all related information – search volume, position on Google, page URL, intent type, active SERP features, average CPC, seasonality, KD, KO and total indexed results. To refine the search you can use filters, column sorting or “exclude” from the analysis domain keywords that are already ranked in TOP10: this way you get a list of keywords and topics on which the identified competitor does not offer optimized content. There is also another way to use this tool: if you focus the analysis on your site and activate the filter that excludes keywords already ranked in TOP10, in fact, you will quickly find out which are content on which you can intervene with improvements to achieve better returns by bringing them inside the first page on Google.

The last feature is “Content Gap“, which allows you to find out if you are missing out on profitable opportunities due to gaps in your site’s content, which has true and proper “holes” compared to what your competitors are publishing and what people are searching for. Again, the research begins by entering a site to analyze: SEOZoom scans the site, the industry and the competitors, then presents a table with keywords relevant to the niche, but on which the analyzed site has no specific content or has content that does not currently rank in the top 50 positions in Google.

In the table you find the detail on the keywords and all relevant information, such as monthly search volume, Search Intent, any SERP Feature, average CPC, difficulty and opportunity, and seasonality. On the right hand side, then, SEOZoom tells you whether it has found pages on similar topics to the selected keyword on the site (and therefore there is a content focus issue) or if the keyword is a pure example of Content Gap.

Filter the values to your liking using the dedicated box: by setting up filters, you can find keywords with high performance potential. You can also select the columns you prefer to consult and export the data of keywords with the highest potential in CSV format for further analysis.

Tools

The Tools area of SEOZoom is your toolbox, where you can find what you need to optimize websites and strategies.

Available in the side menu, the section consists of as many as eight different tools – Analyze Domains List, Analyze Keywords List, Analyze URLs List, Analyze Ranking, Keyword grouper, Analyze Mixed Content, Link Monitor, and SERP Comparator – which we will now go into individually.

Analyze Domain List

As you can easily guess from the name, in the Analyze Domain List section you can enter a list of distinct domains in the box and get analytical data on performance trends, monthly traffic values and keywords placed.

Always remember to enter domains with or without www, depending on how they are actually indexed.

For each domain entered, the table shows a range of key information, specifically Zoom Authority, Trust, Stability and Opportunity, trend (a straight line that gives a visual indication of the site’s performance, i.e., whether it is up, down, or stable), ZA History (a graph showing changes in Zoom Authority over the past 12 months), and then estimated monthly traffic, total number of keywords ranked, and domain IP. As in the other sections of SEOZoom, then, from here you can deepen your site analysis with the Domain Actions in the hamburger menu.

Analyze Keyword List

Analyze Keyword List is a tool that allows you to get analytical data from an aggregated and possibly jumbled list of distinct keywords, with insights into the competitors that are better positioned in SERP for these queries, as well.

To start the function you just have to enter all the keywords you want to analyze inside the box, respecting the limit of 1000 terms per analysis.

At the end of the scan, a table appears showing the main information about each individual keywords, and in particular their average monthly search volume, type of intent identified, presence of SERP features, Keyword Difficulty and Keyword Opportunity level, the average CPC, index of competition level, total number of results indexed for that keyword, and seasonality graph. You can take a further look at individual keys from the hamburger menu at the end of the row.

The other tab “Competitor Info” lists the main competitors identified for the keywords entered, so that it offers important support for more complete data to be used during the keyword research phase.

The data in the table are Volume in Competition (the sum of the volumes of the keywords analyzed for which the competitor is ranked), estimated global traffic, the number of keywords analyzed for which the site is ranked, and the Zoom Authority of the domain. From here you can also directly add the individual site as a Competitor to a project you have already created.

Analyze URL List

The Analyze URL List tool allows you to analyze a list of distinct pages, as the name suggests, and you have three different input methods available (always with a maximum limit of 1000 URLs per analysis):

  • Paste a ready-made list.
  • Ask SEOZoom to automatically derive the latest ranked URLs for a specific domain.
  • Ask SEOZoom to automatically extrapolate a list of URLs positioned for a specific keyword, from among those in the top 5 pages on Google.

SEOZoom immediately provides you with an analysis on the list, identifying: Page Zoom Authority, number of keywords placed, estimated traffic of the URL, potential traffic of the URL. The hamburger menu then takes you to URL Actions and Domain Actions, with which you can further refine its competitor study.

Then, by clicking on the individual URL in the table on the left, you activate the complete, real-time SEO analysis on page performance: as in the other sections of SEOZoom, in this focus you can find all the useful data for the competitor study, with insights on current and potential traffic, indications on the key positioned (All, TOP10, Potential and Distant), but also on the level of optimization and areas where improvements can be made.

Analyze Ranking

The Analyze Ranking tool is very useful to check, quickly, the rankings of certain keywords for one or more domains. You can use it, for example, to quickly find out which page on your site ranks better for a set of keywords, or to do a simultaneous comparison between competitors, starting with a set of specific keywords.

To launch the scan you just have to follow the on-page instructions, and then enter on the left the domains you want to check and on the right the keywords: after a few seconds SEOZoom shows you all the information to find out where that domain ranks for that specified keyword, with an indication of the referring page.

Specifically, for each keyword occurrence the table provides data on the volume of the keyword, position on Google (with indication of the change from the previous SERP scan) and full URL positioned, repeating the same information for the other domains entered. At the end of the row you find the hamburger menu that leads you to the Keyword Actions with which to refine the analysis of the relevant keyword.

Keyword Grouper

Keyword Grouper is a tool that comes to the rescue when you have a somewhat cluttered set of keywords and want to refine your research by grouping keywords based on semantic relevance.

Basically, the tool automatically organizes the keywords you entered by dividing them into groups of related words so to make your work easier when creating content or organizing the structure of your website.

The tool analyzes the keywords entered in the list and provides in the left table the list of identified groupings, with the possibility of viewing the detail of the keywords in the group and an initial indication of the search volume.

The tab on the right allows you to delve deeper into the study of the keywords in the group, of which it individually reports useful data for the analysis, such as average monthly search volume, Keyword Difficulty and Keyword Opportunity, average CPC and graphs on seasonality, with the hamburger menu that, as usual, leads you to Keyword Actions for even more targeted checks.

Analyze Mixed Content

A mixed content happens when a combination of URLs of a site are being simultaneously served over both HTTP and HTTPS, due to a migration process not being perfectly executed or completed.

Analyze Mixed Content is therefore a good ally if you are currently updating the protocol of your sites or if you want to check if the process was done correctly in the past.

Its use is very simple, since you just have to enter a URL address (including the protocol https://) in the search bar and wait for SEOZoom to scan the resources to check if they are, indeed, in HTTPS.

For example, if you enter the entire domain https://www.seozoom.co.uk/ into the analysis.

the tool will inform you that there is no mixed content, responding with the words “Safe to go”.

On the other hand, if the site does not have pages with the HTTPS protocol and is still using the old HTTP protocol, the tool will give you the error “The site is not responding in https”.

The most interesting case is that of true mixed content: if the analysis shows the presence of content served precisely on both HTTP and HTTPS, here you will find a list of resources still in HTTP, which can be useful for you to correct the URLs and increase the security level of the dialogue between your and users.

In fact, the HTTPS protocol is a more secure system of communication between site and user, thanks to the use of the SSL certificate, which encrypts data transmitted in and out, reducing the possibility that user information can be viewed or manipulated by malicious third-parties.

As you can easily verify, then, if you browse a page in HTTP the browser reports an alert, displaying the words “Not secure” next to the URL of the site – while if you browse an HTTPS page you display the closed padlock icon.

In addition, since 2014 HTTPS has been an official ranking factor (albeit a very light one) for Google, and since 2020 the presence of an active HTTPS protocol has become part of the Page Experience factors, so taking care of this aspect can also be relevant for SEO.

SERP Comparator

The last tool in this section is called the SERP Comparator and it helps you identify the underlying affinity level of the keywords and search intent being referenced.

The tool allows you to quickly compare a list of up to 100 keywords: SEOZoom analyzes all the keywords and compares them one by one, indicating in the table on the right the level of affinity between the generated SERPs and thus simplifying your subsequent work of content production, also thanks to the possibility of refining the study of the proposed data thanks to the appropriate filters.

For each individual keyword analyzed, in fact, you can quickly read the average monthly search volume and, in the list below, the SERP Affinity value compared to each of the other keywords you have entered, of which you can also discover the Keyword Difficulty and Keyword Opportunity metrics (as well as perform Keyword Actions for more precise analysis). By clicking on the blue SA button, moreover, you can directly check the Google’s SERP for that keyword and thus find out which results actually appear on both pages and which, on the other hand, appear only in one circumstance.

For each cluster, then, you can also find out what the main keyword is, i.e., the main keyword that Google has identified as most relevant to the search intent of the query, which is flagged with a star.

The comparison is done on the basis of the SERP Affinity metric: in fact, SEOZoom does not show you keywords with SA values equal to 0, and therefore only compares keywords that generate SERPs in which there is at least one similar result.

Unlike the other tools in the suite, moreover, in this section the comparison is between all the keywords you have available, not just with the Main Keyword, and this can help you to set up another approach to keyword research.

Rank Simulator

Rank Simulator is a tool that precisely simulates and anticipates the impact of SEO optimization interventions on keywords and pages, useful to support with predictive data a quote to present to clients, direct the work of consulting and site optimization towards more profitable pages and keywords or, simply, identify at a glance a cluster of keywords on which to act as a priority for your project.

This intuitive and easy-to-use feature allows you to simulate the impact of optimization work on a keyword set, specifically estimating the growth effect on the site that an improvement in current ranking might have.

It all starts with entering the domain on which you want to run the simulation and selecting the keywords to analyze. You can choose the keywords manually, typing them into the search bar and then adding them by clicking on the plus button, or – more quickly and efficiently – import an already reasoned list of keywords saved earlier with the “Your Keyword Research” tool. In addition, you can also save the list you created in Rank Simulator, which will always be exported among your keyword research.

Now the simulation work begins: the tool allows you, in fact, to know the current ranking and organic traffic data of each keyword and to estimate the levels that can be reached through improved ranking. In simpler terms, for each keyword you can know the estimated volume and change in quantitative terms reaching the position in SERPs that you want or think is realistic (by default, the tool “pushes” you towards the first position, but you can also set the simulation to a position more concretely attainable by the site you are examining), and thus discover the actual and overall value of a strategic optimization work on the set of keywords under analysis.

But this tool also offers another added value: by clicking on “Show work plan,” in fact, you get a kind of summary document that indicates the steps to achieve the estimated goals, with the possibility of direct access to the planning of the necessary content.

First of all, in the screenshot you can read the quantification of the impact of the optimization work, showing the estimated values of traffic and visits, also in percentage terms.

And then, to facilitate the strategy, here comes the highlight of Rank Simulator: the identification of URLs to improve or new content needed to intercept the keywords analyzed and achieve the expected results.

Basically, the tool creates a document (downloadable in .doc format) that describes precisely the Work Plan that can lead you to the simulated traffic improvement, dividing the interventions between ” Pages to improve” and “New pages to create.” As mentioned, the former are those that already have keywords ranked on Google but in positions of lower visibility than the simulation, and therefore require content improvement and SEO revision (perhaps even through link building actions). When the tool does not find referring pages for the keywords being analyzed (i.e., if the URLs are in positions above 50th or if there is no content that intercepts them), it advises you to create new pages and then make content that is optimized according to SEO copywriting best practices.

In both cases, the tool gives you immediate possibilities for action, because it leads you directly to editing or creating content through the Schedule Article (which directs you to the Editorial Plan for Editors, with the possibility of assigning the article to the copywriters involved in the project) or Assistant (which takes you to SEOZoom’s Editorial Assistant) buttons.

Reports Area

In the Reports area of the side menu you can find features and tools that allow you to get overall overviews of the health of your site, which you can share with your team and clients or use to better analyze your project’s performance, critical issues, and potential areas for development.

Reports Management

With SEOZoom you have the possibility to create an SEO analysis document to present to your clients, colleagues or stakeholders or to use personally to study your project in more depth even off-line: the PDF Report is a kind of quick, customizable and complete SEO Audit, with which you can view, data and graphs in hand, the results of the work you have performed on the project and the progress of your possible SEO consulting and optimization activities.

The SEO reports section is available to all subscribers, with quantitative differences on the number of documents that can be scheduled based on the type of plan you subscribed to. The access screen is quick and intuitive, allowing you to check the reports you have already created, move an outdated document to the bin (and possibly retrieve it if needed, if you have not yet emptied it in the meantime), and add a new report.

The creation of the first report (and that of a new document anyway) is very simple, and you need only follow the directions in the different fields of the form that appears on the page. Specifically, you are asked to enter a name for the document and to decide whether to schedule the file to be sent, at what time interval and to which email address to send it (the recipient will automatically receive an email from SEOZoom on the set date); finally, you have to select a site (from your projects or generic) with which to start structuring the report, knowing however that it is still possible to manage or change the domain to be analyzed at a later time.

The screen present at the opening of the tool represents the first page of the document, which you can customize by choosing from the different layout templates available so to find the solution that seems most valid to you, with the additional chance of importing a template that has already been created in a previous report. Immediately below are the categories Keyword – Monitoring – Pages with the specific widgets that you can insert into the pdf file in a simple drag & drop mode, to enrich the report with graphs, tables and data from SEOZoom in order to build a complete SEO analysis. Lastly, the “Page Elements” section allows you to manage aspects related to the presentation of the Report, and in particular to insert a title, a cover image (which can be your official logo or that of the client’s site, for example), explanatory images or real and proper text boxes that will give the document the form you prefer and need.

In practical terms, then, you will have the ability to configure each individual widget with a single click, providing SEOZoom with your preferred directions to achieve the display best suited to your needs.

Keyword Analysis

Here you can get a report on a single, specific keyword: simply choose the keyword you are interested in, set preferences on the document header, and launch the generation of a detailed PDF report, which you can download or email.

URL Analysis

Here you can get a report on a single and specific web page: just choose the web page to be analyzed, set preferences on the document header, and launch the generation of a detailed PDF report, which you can download or email.

Domain Analysis

Here you can get a report on a single, specific website: just choose the website you are interested in, set preferences on the document header, and launch the generation of a detailed PDF report, which you can download or email.

Quick Audit Domain

Quick Audit (available from the Professional plan) is a more detailed tool, which takes the form of a real SEO analysis of the site. In fact, the self-generated document also walks you through the insights, providing useful hints to understand what the values shown mean and, therefore, to quickly evaluate the site as a whole.

Time Machine

Time Machine is located within the Report section and will be available if you subscribed to a Professional plan or higher.

With this feature you can perform a real jump back in time to analyze:

  • Which keywords have dropped and which have been rewarded with improved rankings.
  • The Pages as a whole, highlighting those that are declining and those that are growing.
  • The backlinks received on the pages for the period under analysis.

The scan starts by entering a website and setting the time period you are interested in delving into: SEOZoom analyzes which keywords have lost visibility and which ones have improved their position in that time frame.

Some practical information: the minimum analysis is based on a 7-day time frame, and a site does not need to be within the project area to launch a Time Machine scan on it.

When the document is ready, the dashboard will notify you with “Analysis Ready”, in green.

In the boxes at the top you can look at an initial comparison of the situation as it stands on the first date entered and the final date, with a focus between the different levels of estimated traffic and Keywords in TOP10, as well as quick insights into new backlinks acquired during the period analyzed.

In the chart on the right you have an overview of site performance, while the tables at the bottom, divided into 4 sections, are the heart of useful information for your strategy.

The first tab is “Loser Keywords“, which shows a list of the keywords that have declined in the selected period: in particular, for each keyword here you can see the average monthly search volume, the previous position occupied in SERP and the current position – considering by current position the final date you entered in the analysis – the positioned URL, the estimated previous and current traffic, and lastly, the estimated lost traffic.

Next you find the “Loser Pages” tab, which instead lists the pages that suffered a drop in the selected period: in the overview, you can see for each row the positioned URL and the previous and current traffic values, the estimated lost traffic, the number of referring domains and links that the page eventually received. By clicking on Keywords or the arrow, moreover, you can check in detail which keywords have precisely lost ranking and what kind of negative variation they have had in the examined period (so you can also group loser keywords by URL, for a more useful and effective evaluation).

In the “Winner Keywords” and “Winner Pages” tables, then, you can find the same – except mirrored – information: that is, you can analyze which keywords and pages have improved their rankings and overall Page traffic in the selected period.

Here again you find the estimated traffic you gained and the referral URLs.

Website Rankings

The Websites Rankings tool allows you to know immediately the most popular and best websites in the UK (and the other countries available, depending on the set database) according to Google, presenting a ranking of the top 100 domains in each sector, sorted according to the trust showed by the search engine.

In addition to checking the overall ranking of the best British websites, in fact, you can discover the ranking by filtering the results according to the specific sector or niche you are interested in; again, you can also launch a search by manually entering the address of a site in the search bar, getting in response the total list of the sectors in which it competes and is ranked.

For each domain, SEOZoom shows you the ranking values (which is precisely its place in the rankings for the specific category or sector), the total traffic, the number of keywords relevant to the sector placed on Google, the level of Topical Zoom Authority, while the last button “Sectors” allows you to delve into the site’s performance in the rankings of each sector in which it competes.

The Rankings are a useful feature for understanding how Google sees your site, for instance, and whether it can best categorize the content you propose, but also for studying a competitor, to see in which areas/topics they are boosting their activity, or to find potential partner sites on related topics with which to collaborate for link earning.

However, there are some aspects to consider in order to best understand how the tool works:

  • Sectors are categorized according to Google’s own rules and criteria – and therefore SEOZoom does not decide that a site belongs to a sector or that a keyword belongs to a subcategory, since the categorization of the data totally depends on the search engine’s scans and sorting.
  • A keyword can also be present in multiple sectors, and association is not always “obvious”, especially for websites that tend to have keywords that fall into different sectors.

Observatory

The Observatory is the section of the suite that provides you with two different tools that are updated practically in real time: SERP Observatory is a set of data on Google’s search results pages and current movements, while instead ZA Observatory is an ongoing focus on the distribution of all sites ranked according to Zoom Authority, our proprietary metric that objectively assesses the quality of a domain in Google’s eyes.

Let’s take a detailed look at the features of these two features.

SERP Observatory

In SEOZoom’s SERP observatory you can see at a statistical level what kind of fluctuations there have been among the search results pages on Google UK: composed of a summary table and four specific tabs, this tool allows you to find out at any time the variability of Google pages on all keywords and is ideal for checking the fluctuations between results caused, for example, by periodic algorithmic updates.

Understanding the data is rather simple and intuitive, thanks to the colored symbols and icons that give at a glance information about the level of movements.

To be precise, the tool takes as a reference an average trend of oscillations – that is, results entering and leaving the first page of Google – and analyzes day by day the level of deviation from this average.

Therefore, the thunderstorm symbol (dark gray cloud with lightning) and the correlating red dot in the graphs indicate that the data collected by SEOZoom signal very high activity, with significant changes within the SERPs. The second degree of this volatility is represented by the rain symbol (light gray cloud with raindrops) and the yellow colored dot, which indicate high activity, above the historical average. On the other hand, the average range is represented by the small sun drawing and the blue dots, informing us that Google’s activity is regular and the results do not deviate from the average. Finally, the clear moon icon in the table and the light blue dot in the graph are indications of moderate activity, lower than the standard percentage of fluctuations.

To make the reading even clearer and quicker, two colored bands also appear in the graphs that visually identify the standard average of variations on SERPs: the green colored one encloses precisely the average recorded level of activity, while the yellow one embraces variations toward more intense movements. In addition, the “G” symbol along the x-axis indicates times when official Google updates have been released, which may explain subsequent fluctuations.

In the tabular version, the Observatory offers monitoring of the SERPs over the last week or, by selecting from the menu provided, the last calendar year, and calculates the values of the variations compared to the average activity on Google result pages.

The data are broken down into 4 separate tabs:

  • Dropped from TOP10: the frequency of changes in the first page of Google results for each keyword, with the alternation between sites exiting and those entering TOP10 instead.
  • 1st page fluctuations: the frequency among internal variations on the first page of Google results, with pages changing position while still remaining in TOP10.
  • Small SERP variations: daily analysis of the percentage of web pages that experience minor position changes, to identify ongoing changes in the behavior of Google’s algorithm.
  • Big SERP variations: analysis of the percentage of web pages that experience big variations, which can be considered a continuous quality test of web page performance by Google.

You can also check the information in the graphical representations, which show monitoring over specific ranges (1 month, 3 months, 6 months, 1 year), to provide an even wider reference and thus visually discover all the continuous Google variations.

You can use the SERP Observatory as a point of reference when you notice unusual movements among your site’s ranked results, to get immediate feedback on what is statistically happening on Google UK and to get immediate signals to understand whether the perceived high variability on your pages depends on external factors – updates, in fact, or other overall movements – or whether it is instead an issue related to your individual project.

Remember, however, that having data is important, but knowing how to read it is even more useful and strategic. Moreover, we recommend you to always put the data in context before panicking. And, in the meantime, keep your eyes wide open!

ZA Observatory

The Zoom Authority Observatory presents tables and graphs representing the distribution of domains in SEOZoom in the different Zoom Authority ranges, to always give you a global overview of the websites in our database with reference to the British (or Italian, Spanish, French, German, according to the database) market.

The tool helps you instantly understand the level in which a site is ranked according to our metrics and is a strategic reference both to better understand the context in which your site moves, and to determine whether the ZA of a domain is good or not, for example when evaluating for link building activities or simple competitor analysis.

The table on the left lists 10 ranges of Zoom Authority values (0-10 to 91-100) and immediately shows the number of sites that fall in the specific range and the quantitative change from previous monitoring. In addition, if you click on the individual range, the graphical view opens, going into more detail about the distribution of domains by ZA score, showing the full scale.

Then, at the bottom, there are two very useful summary tables: Winner Domains and Losers Domains.

In the first one you find the list of sites that have gained at least one ZA point since the previous survey, while in the second table there are, as you can easily guess, the sites that have instead lost ZA.

Orientatively, ZA estimates are updated once a month.

This feature can serve to keep track of ongoing changes on the SERPs and, for example, can provide you with valuable insights in the periods following Google’s updates, to find out which sites have benefited from the interventions and which, on the other hand, have suffered visibility slumps.

The usefulness of the ZA Observatory is, of course, related to the Zoom Authority, a metric increasingly used on a global scale for evaluating a site, as it is able to offer a fairly reliable and useful snapshot of the value of each site, taking a look at fundamental and “objective” aspects such as organic traffic, engagement and growth opportunities.

Frequently Asked Questions

How is Zoom Authority (ZA) calculated?

The parameters are based on a logarithmic scale from 0 to 100: therefore, the distances between the ranges are not uniform and constant, but each “notch” is based on the logarithm of each number. Thus, a drop from 60 to 50 is much larger than a drop from 50 to 40, and it is easier to increase the ZA in the lower ranges, while it becomes increasingly difficult to increase it when higher thresholds are reached.

Summarily, the signals and elements we take into account are a weighted mix between: number of keywords placed, search volumes of keywords placed, keyword distribution, keyword competition, trend of the last months (up or down), and, to a small extent, some social aspects. Backlinks are not taken into account, since there is no certain way to know how they are really evaluated by Google.

It is clear that, just like the other original proprietary metrics (Moz’s DA, Majestic’s Trust Flow, or Ahrefs’ DR), ZA is not something that really matters to Google, which evaluates sites with its own algorithms, criteria, and ranking factors. Each proprietary tool focuses on the signals it deems most useful and relevant to the data it holds – for example, Trust Flow is based purely on links, DA is a mix of placements and links, and so on – and it is not possible to determine whether one metric is better or more accurate than the other.

Rather than just reading the numerical value, in fact, it is more useful to contextualize the data based on the tool used and broaden the analysis to include other elements to really evaluate the site.

As far as the ZA is concerned, and to obviously further our own cause, it is a reliable value since it is based on direct observation of Google’s behavior and liking of a site, without trying to determine and estimate any other ranking factors or algorithms based on predictive, simplistic if not manipulable values.

How to adjust with Keyword Difficulty (KD) values ?

To keep it simple:

  • 1 to 33: easy goals
  • 33 to 66: medium goals
  • 66 and up: difficult objectives

However, the matter is much more complex than that, because KD metrics (as well as Keyword Opportunity) should always be contextualized and it is not advisable to choose one topic over another solely because of a higher or lower score.

Specifically, KD is calculated based on the sites placed in the top ten in the SERP: if there are giants such as Wikipedia, Youtube, Amazon, which have a high Zoom Authority, the value of KD increases. On the contrary, in other SERPs of very specific niches there might be less big competitors, but no less competitive and, on the contrary, much more focused on the topic.

And so, in the first case, the presence of “big players” should not scare you away, since sometimes these domains have poorly optimized pages and rank thanks to the trust acquired, or in any case Google might even leave room for smaller sites, but capable of providing a different point of view and useful content for users, differentiating themselves from the “generalist” giants.

In the other case, on the other hand, specialized sites could be much more relevant and vertical on the topic, already offering optimized content, and thus the competition is paradoxically more complicated.

In summary, then, KD is a parameter that lets you know at a glance what kind of effort and strategy you have to work out when producing content, but it should be considered along with the many other factors that are at play when it comes to ranking and SEO.

Is the main keyword always to be preferred?

The answer is, trivially, “it depends”. Because, again, you should not just read the data, but interpret it, contextualize it, and apply it to your site and strategy.

In general, it is important to know whether or not you are working on the main keyword in order to make the appropriate assessments of the prospects for content performance.

Then there are specific cases where it is preferable to focus your work on the main keyword, particularly if:

→ your site is strong and competitive with the current TOP10.

→ the main keyword is really interesting for your site (and is not, for example, a very generic word that might not be functional for the results).

Conversely, it might be more useful to work on a secondary keyword when:

→ your site is less competitive and therefore it becomes necessary to target “side” SERP possibilities.

→ the secondary keyword still has enough volume to make it strategic and interesting.

How often are keywords scanned in SEOZoom?

Times vary based on multiple factors, including the “size” of the keyword itself. To provide an overview to keep in mind with the most common scan times:

  • Keywords saved in a Project: Every 24 hours, always, for any search volume.
  • Keywords with high traffic volume, but in no project: Every 7 days
  • Keywords with medium traffic volume, but in no project: Every 15 days
  • Low traffic volume keywords (e.g., volume 10): Every 21 days or so.

So if you are interested in having up-to-date data and values, the recommended solution is to add keywords of interest to a project.

How often are monitored pages updated?

With monitored pages SEOZoom does not scan the pages you have entered, but the keywords contained within individual URLs. This means, therefore, that the update times are the same we summarized in the previous FAQ and depend on the type of keyword and whether or not it is included in a project.

Why do SEOZoom’s traffic estimates not match those of Google Analytics?

Like all other SEO tools, SEOZoom does not measure direct accesses to the site, but it works out an estimate on accesses by monitoring the keywords in its database and their positions on Google, calculating the potential value of a site’s organic traffic accordingly.

In contrast, Google Analytics monitors the totality of a website’s visitor statistics and analytically counts the traffic reaching the site based on individual accesses, offering actual site traffic measured one visit at a time.

For this very reason, the values of Analytics and those of estimation tools such as SEOZoom are not comparable, and indeed we can say that it makes little sense to use the suite’s metrics to guess at organic traffic and compare it with that of Google tools.

SEO tools have a different purpose: they use a sample of keywords to show Google ranking trends, allowing you to figure out whether your site is going up or down for those keywords (which Analytics cannot do), to evaluate a competitor’s traffic in relation to your own, and to catch all traffic opportunities.

Basically, if you need to know your actual traffic, Google Analytics is the most effective and accurate way to go. If, on the other hand, you need to estimate metrics that help you grow, SEOZoom is for you, partly because it has the great advantage of relying on a larger sample of keywords than competitors.

Why don’t SEOZoom’s traffic estimates match those of tool X or tool Y?

The answer to the previous FAQ applies: the data base, the keywords surveyed and the sample on which the estimation is made are different, which is why the information processed by one tool may not be similar to that of another tool.

X Tool gives me this data, Y Tool gives me other data, SEOZoom some more. Who is right?

Everyone and no one: as we said before, Keyword Analysis tools are based on proprietary data samples, metrics and algorithms, and each one develops the tool according to its own methods and data with the goal of helping a website owner analyze the situation. The purpose of tools like SEOZoom is not to just guess traffic, since the mere number is useless, but to propose consistent and useful data to optimize strategies and grow one’s online project.

Why do some rankings detected by SEOZoom not match what I see on Google?

There are several factors that can lead to a discrepancy between the page rankings reported by SEOZoom and the SERP rankings checked on Google.

  • Browser history. If you use the search engine while keeping access to your Google account active, your search results may be affected by your browsing history. In this case, be sure to use your browser in Incognito mode, which always proposes an “anonymous” and “neutral” SERP.
  • Geolocation. The keyword you are analyzing may be influenced by geolocation. For example, if you search for “pizzeria” or “dentist,” which are local and generic businesses, Google will automatically tend to provide you with results in your area or at least in the area closest to the geographic area in which it locates your location. To avoid geolocation influences, SEOZoom analyzes the data on a national basis, and so there may be differences and discrepancies from what you are seeing. In any case, SEOZoom allows you to add localized keywords, so you can simulate the actual geographic location seen by Google and more accurately track your results.
  • Scan times. The detection by SEOZoom occurred at a different time than your search. There are keywords that vary as many as dozens of times a day, because Google runs thousands of tests to understand user liking or even because its own data centers are not perfectly aligned. What you need to do in this case is to check SEOZoom’s scan date and make sure it is recent (as mentioned in a previous FAQ, keywords entered in a project are crawled every day).

Generally speaking, however, you should not worry too much about any of these situations, since on large numbers the positions are always correct and the exceptions are few. And then, as best practice, we are no longer in the era of keyword targeting (of the work focused on optimizing individual keywords), but modern SEO is based on a “keyword set” approach, linked by the same Search Intent.

Why do search volumes reported by SEOZoom for some keywords differ from the Google Ads Keyword Planner?

Average Google Ads volumes vary quite often: basically, every month there is a recalculation of values in relation to the seasonality of the previous year, and Ads volumes are far from accurate and close to reality.

To go into technical details, Google Ads breaks down search volumes into macro blocks called buckets: if you have an active Ads campaign you can see the breakdown of volumes into 77 buckets, while as a free user you can see 8 of them. For this reason, a keyword that Google shows you from 100,000 monthly visits might make far less than that. In addition to this amalgamation into macro blocks, Google Ads also tends to amalgamate very similar keywords: for example, the two keywords “Used Cars” and “Used automobiles” are combined by Google into a single keyword ranging from 100,000 monthly to 1 million.

SEOZoom, on the other hand, tells you that these are two distinct keywords with different search values (246 thousand for used cars, 2900 for used automobiles) similar, but not identical SERPs. Basically, thanks to historical data and its algorithms SEOZoom understands if a keyword has been merged and tries to identify the traffic that most closely matches.

Finally, to ensure that the data is congruent and no sudden variations are shown that are not justified in reality, SEOZoom does not update traffic values in real time, but on a semi-annual basis, averaging with previous values.

Why does domain analysis return few or no results?

The absence or low amount of data about the domain in SEOZoom may depend on a few factors, starting with the fact that the last SERP crawl did not find its pages positioned in TOP50 for any or at least few keywords.

Monthly traffic figures are estimated based on the CTR of the placed keywords: SEOZoom considers the volume of the keyword and, depending on its rank, estimates a percentage of traffic that the analyzed site receives.

SEOZoom’s organic traffic value represents an estimate of visits based on tracking the keywords in its database and their relative positions in the top 50 positions on Google (for each international version of Google in the database and scanned, i.e. currently Italy/UK/ES/FR/DE), and is therefore not the precise figure of individually tracked visits, as Analytics does.

This means that until the site and its URLs rank better in the organic SERPs, SEOZoom will not be able to estimate traffic, and will start doing so as soon as the keywords for that domain rank at least in TOP50.

To speed up the process, you can first add the site to a project, so that you can monitor it more effectively and timely, while also acting on several points. Specifically:

  • If the last SEOZoom crawl had not detected URLs positioned in SERPs for any or a few keywords, BUT the site’s pages actually appear to be positioned for long-tail keywords or keywords with little volume, YOU CAN add these keywords to the monitored keywords and track them.
  • If the domain is ranked, BUT those keywords are not present in SEOZoom (we have the richest databases in the market, and for example for Italy we own a db of over a 1.5 billion keywords, but it would be impossible to own “ALL” the keywords), YOU MAY consider adding those keywords to the monitored keywords, perhaps by importing them directly from Search Console or Analytics through the Import Keyword button.
  • If you verify that the site’s URLs are not actually in the TOP50 positions, you MAY wait to find out if it is just a “time” issue (especially in the case of new pages) or decide to intervene with content revisions using SEOZoom’s tools and tips.

Why is URL analysis not returning any results?

The absence of data – as in the screen – depends on the fact that the analyzed URL does not have any keyword registered in our databases (Italy/UK/ES/FR/DE) that is among the top 50 positions in Google SERPs, at the last crawl of our spider.

This situation can happen for a few reasons, all of which stem from the fact that, at the last scan, the URL was not found positioned for any keyword in SEOZoom’s databases.

You have a few solutions to try to monitor the performance of these URLs:

  • If the URL actually did not have keywords positioned in SERP at the last scan, BUT you can see that it is positioned for long-tail keywords or keywords with small volumes, you MAY add those keywords to the monitored keywords.
  • If the URL has keywords positioned in SERP in TOP50 positions, but those keywords are not present in the SEOZoom db (it would be impossible to own “ALL” keywords), you MAY consider adding those keywords to the monitored keywords.
  • If you verify that indeed the URL does not rank in TOP50 for any keyword, you MAY wait to find out if it is just a “time” issue (especially in the case of new pages) or decide to intervene with content revisions using SEOZoom’s tools and advice. To make sure you don’t miss any movement on this page, add it to your Project’s Monitored Pages.

Why does Google Search Console detect backlinks for me but SEOZoom does not (or vice versa)?

Backlink detection is done by physically sending the crawler to scan page by page all the billions of pages on the entire web. Due to its sheer volume, Google has near-instantaneous processing capabilities, whereas SEOZoom obviously cannot keep up and scan the entire web. For this reason, we prefer to prioritize pages in SERPs for at least one search term, so as to show what Google has actually already viewed and weighed. On the other hand, it sometimes happens that SEOZoom detects backlinks but in Search Console they are not there: this can depend on various factors, because Google’s algorithm might have ignored that link considering it of poor quality, or because a disavow was used, or again the Search Console data are not perfectly aligned in real time.

Is it possible to analyze sites in other languages?

SEOZoom currently features different international databases, and specifically allows you to analyze performance on Google Italy, Google UK, Google France, Google Germany and Google Spain.

You can also use SEOZoom as a simple “rank tracker” and track keywords of your choice in all languages and on all international versions of Google: to do this, you need to log in to the project, go to edit and set up keyword tracking according to the parameters you need. In this case, however, you will not display the keyword’s volumes, only its ranking in SERPs.

Another multilingual option is in the Discover Keywords tool, which allows you to search for related, long-tail keywords on all the other international SEOZoom databases and more.

Are there any APIs for SEOZoom?

Yes!
You can access the SEOZoom API with any active plan, simply by clicking on the API Dashboard link in the drop-down menu that appears when you click on the icon with your username.


The service has a pay-as-you-go cost, but we offer you 6,500 free API units per day: so your credit will start to be scaled as it runs out and you can easily top it up within the suite. You can view the entire Documentation at https://apidoc.seozoom.com/ .


Glossary

Actions (hamburger menu)

One of the winning features of SEOZoom is the ability to perform real-time SEO analysis on all sites, both of your own and competitor ones, gaining so much useful information for your strategy. In addition, all the tables activated by the various tools offer multiple contexts for each data grid, with the possibility of deepening the analysis by clicking on the hamburger menu, which gives access to a series of specific actions related to the keyword, URL or domain we are examining.

Specifically:

  • Keyword Actions” allow you to deepen the latest SERP, analyze the keyword, its search intent, find similar keywords, and set up a new article based on the keyword with the editorial assistant.
  • URL Actions” on the other hand, allow you to browse the site URL, run a specific analysis, analyze the search intent of that individual page, add the page to monitored URLs (if you are within the project), and launch an OnPage SEO analysis.
  • In the end, “Domain Actions” focus precisely on information related to the entire site, to launch a full domain or Root Domain analysis, to browse the domain, discover its top keywords, check the backlinks it receives, and make a quick comparison with organic competitors.

Cannibalization

Cannibalization or keyword cannibalization is the presence on the same site of pages that are similar in content and, more importantly, in keywords ranked by Google. This predicament occurs when Google’s algorithms have come difficulties figuring out which URL of a site to rank for a given keyword, finding precisely at least two competing on the same key. Typically, two scenarios occur when this happens: Google alternates between the two pages in its ranking, sometimes favoring one and sometimes the other, or it makes the “wrong” and less efficient one with respect to the desired strategy rank, causing the entire site to lose overall ranking.

Competition

Competition is a value provided by Google Ads and indicates the level of competition present in Ads. The value ranges between 0 and 1 on a decimal basis: where 0 stands for little competition, while 1 represents maximum competition.

Crawl budget

The crawl budget is a parameter that identifies the time and resources Google intends to devote to a website through Googlebot scans, a value that is not unique or numerically definable.

In Google’s view, the crawl budget is the number of URLs that Googlebot can (based on site speed) and will (based on user demand) crawl. Conceptually, then, it is the frequency balanced between Googlebot’s attempts not to overload the server and Google’s general desire to crawl the domain.

Optimizing the crawl budget means, essentially, avoiding wasting server resources and Googlebot time on crawling pages that do not generate results and do not offer added value for users, since this risks missing out on quality site content and important pages (those that convert or attract the most traffic). Taking care of this aspect, in fact, could allow you to increase the speed at which search engine robots visit pages on the site: the more frequent these steps are, the more quickly the Index detects page updates, potentially allowing you to help keep popular content up-to-date and prevent older content from becoming obsolete.

SEOZoom’s Pages Performance section provides a concise, at-a-glance view of URLs that engage and waste the most crawler resources since they do not even have a single keyword ranked on Google and therefore do not contribute to the site’s organic traffic. These pages with zero traffic may be positioned but not relevantly (i.e., they are outside Google’s TOP10) or they are positioned with keywords that have no search volume. Before intervening with any corrections and thinking about removing such pages, however, we always recommend checking the actual returns using Google Search Console and especially Google Analytics (they may be pages that receive traffic from social or other extra-Search channels, for example, which we should therefore not remove).

Follow

Follow, sometimes also referred to as dofollow, is one of the possible values we can set to the rel attribute in the <a> tag of a link to indicate to Google the relationship to the linked page. Actually, the follow attribute does not have to be set manually, because it is inserted by default in every outbounding link.

A follow link tells Google that the linked page should be followed as authoritative and that the link itself should be taken into consideration for the purpose of ranking the site it points toward.

Read more > here

In Content (IC)

The In Content percentage value indicates how many websites in SERP made use of the Exact Match keyword (spelled exactly as it is) in the text of their web page. The value highlights how obvious the competitors’ attempt to rank for that keyword is.

Branded Keyword

Branded keywords or brand keywords are search queries that include the name of a brand, a variation of a brand or the name of a specific product and trigger a SERP that classically includes the brand’s own website, products and social media accounts. They represent a classic expression of navigational search intent, since they are the terms generally used by people using the search engine to access a specific Web site or Web page.

Examples of branded keyword queries are “McDonalds Menu”, “Oral-B electric toothbrush”, “Samsung smartphone”, “SEOZoom blog.”

The SEO value of branded keywords is very high because they can not only increase a site’s traffic and audience, but can also help direct searches to specific targeted pages to finalize conversions.

Read more > here

Keyword Difficulty (KD)

Keyword Difficulty is a proprietary metric that indicates the ranking difficulty for a given keyword and estimates the level of competitiveness of a SERP based on the analysis of competitors placed in TOP10 and their Zoom Authority. It is a value from 0 to 100 on a logarithmic scale – the higher the value, the greater the difficulty of ranking for that keyword since the more competitive and authoritative the competing domains are, with high levels of ZA.

Keyword Opportunity (KO)

Keyword Opportunity is a proprietary metric that estimates the level of opportunity to place a keyword in TOP10 based on the analysis of the level of optimization of page snippets currently in TOP10 and the level of competitiveness of the SERP. It ranges from 0 to 100 on a logarithmic scale: the higher the value, the easier it is to rank for the analyzed keyword, since the less optimized the results and the less strong the trust of competitors in TOP10 is.

Longtail Keywords

Longtail keywords or long-tail keywords are the keywords typically composed of three or more terms, that are more specific than short-tail keywords (which are instead more general and broad) and, therefore, characterized by significantly lower search volume and traffic than exact match keywords.

However, longtail keywords can have important SEO value, because they are often more easily affordable than the high competitive exact match and, in addition, are closer to spoken language and more specifically intercept users’ search intent, thus bringing a more profiled visitor to the page who is interested in what we are proposing.

Nofollow

The nofollow attribute mirrors the follow one, and allows us to send search engines the instruction “Do not follow links on this page” or “Do not follow this link“. With this attribute we are telling Google that we prefer not to associate our site with the linked page and not to crawl that page from our site.This has not been a directive for some years now, however, and so Google may well disregard the instruction.

Read more > here

Trend Prediction

“Trend Prediction” is an algorithm that provides accurate information about search volumes in real time, the only one of its kind among SEO tools.

The feature is already integrated within the seasonality chart in keyword analysis and allows everyone to have clear information, but most importantly real data, to understand what is happening to searches in current events, and not on the canonical (and sometimes outdated) historical search volumes.

In technical terms, the new algorithm is able to project the interest shown in the previous 12 months onto today’s real scenario using search trends.

Read more > here

Page Zoom Authority (PZA)

Page Zoom Authority (PZA) is a proprietary metric that immediately informs about the authority of the individual web page under analysis.

Values are expressed on a logarithmic scale from 0 to 100.

Page Zoom Authority is calculated by considering keywords on the first page, potential keywords (those between the second and fifth Google pages), and the estimated traffic volume of the page itself.

PBN

PBNs – Private Blog Networks – are essentially networks of Web sites that can be traced back to a single owner. Although they do not necessarily represent a negative dynamic, historically they have been used for artificial link building, essentially grouping together low-quality domains created exclusively (or primarily) to host paid backlinks in order to force the ranking of linked sites. As such, they openly violate Google’s guidelines because they represent a prohibited technique for manipulating algorithms and influencing ranking on the search engine.

Reports

There are three different types of Reports in SEOZoom, plus monitoring, which you can enable as an option in the Project.

  • Reports Management is the section accessible from the side menu (Report -> Reports Management) where you can create, set up and manage custom reports with different widgets and data from the suite.
  • Quick Audit (available from Analyze Website) is an auto-generated document with a quick SEO analysis of the site, combining tables and data with textual cues useful for understanding the values shown.
  • PDF Report (available from Analyze Site, URL, Keyword) allows you to generate a PDF file that shows table data related to the type of scan performed.
  • Project Keywords Monitoring is a function that can be activated from the Project settings, which allows you to receive a weekly summary of the performance of only the monitored keywords via e-mail.

Results (Indexed Pages)

The term “Results” refers to any page indexed by Google and displayed in a SERP, which is precisely the acronym for Search Engine Results Page. Simplifying, the SERP is thus the Web page that each search engine generates in response to a user’s query, consisting (also) of a list of Web pages relevant and related to the query entered.

In our context, we define “Results” as the total number of Web pages indexed in response to a search performed.

Search Intent

The Search Intent represents what is behind every search on Google or any other search engine: it is the reason why, the primary need that prompted a person to use Google and make a search, and in some way it already encapsulates what the person expects to find in the SERPs.

The intent may address different needs and requirements, but for simplicity in the digital marketing and SEO field, the users’ search intent is made to fall into a few macro-categories of queries:

  • Navigational (N): The user is looking for information in a specific context or on a particular site.
  • Informational (I): The user is interested in information about a particular topic.
  • Transactional (T): The user making this search is ready for action and transaction (purchase, but not limited to).
  • Commercial (C): The user wants to gather data and information before making a purchase.

Each of these search intents can be associated with different journey experiences, distinct keywords, and often even completely different SERPs. Therefore, modern and effective keyword research needs to analyze the search intent to understand what your target audience and potential customers want and need, but also understand what Google is bringing up in its SERPs, and then plan strategy accordingly and write content that resonates with what people who search online really need.

Read more > here

SERP Affinity (SA)

SERP Affinity is a value that indicates as a percentage how similar the keyword being examined is considered to be to the Main Keyword by search engines. The value is calculated by an SEOZoom algorithm that analyzes URLs and organic search results.

To make it simple, the SA compares the keyword under analysis with the Main Keyword and indicates in percentage how many TOP10 ranked results are in common between the two SERPs.

SERP Features

SERP stands for Search Engine Results Page, and in our context it refers to Google’s results page: while it used to show only 10 blue links that referred to the pages deemed most relevant to the user’s query, today the SERP is composed of boxes, features and various elements that have revolutionized its aesthetics and usability to better respond to the user’s true search intention, personalizing their experience and maximizing their satisfaction.

Today there are about thirty different features in Google’s SERP, and in particular SEOZoom’s crawl allows you to identify the presence of the following SERP Features that are activated for various keywords:

  • First visible result after a scroll
  • Direct response from Google
  • Zero Result
  • Google Ads
  • Google Ads at the bottom
  • Google Knowledge Panel
  • Google News Carousel
  • Carousel Photos
  • Video Carousel
  • Google Shopping
  • Twitter Carousel
  • Frequently Asked Questions Box
  • Google Hotel Search
  • Google Flight Search
  • Google Job Ads
  • Google News
  • Photo blocks
  • Expandable carousels
  • Google Bubble Box
  • Google Local Pack
  • Other Google Boxes
  • Mispell
  • Knowledge Panel in SERPs
  • Google App Bar visible
  • Google Images List
  • Google News List
  • YouTube Video List

Topical Zoom Authority (TZA)

Topical Zoom Authority is a proprietary metric that helps to quickly evaluate sites within individual market niches.

By using this value, set on a logarithmic scale from 0 to 100, it is possible to identify the best site for each online industry and find out the level of authority of each site in each vertical niche. Through TZA, SEOZoom is able to precisely rank each site within a topic for which it has keyword rankings on Google, effectively creating a new ranking that goes beyond overall domain value and keyword search volumes.

Read more > here

Traffic Share

Traffic Share is an original SEOZoom metric that allows you to view the percentage breakdown of the overall traffic generated by a cluster of keywords pertaining to the same intent and thus identify the best content and domain that competes for a specific keyword or with a URL.

This metric appears as a detailed table in Analyze Keyword and as a column with percentage indication in Analyze URL/Competitor, and shows precisely the percentage distribution of the overall traffic of the whole cluster of keywords that refer to the search intent, extending the analysis not only to the main keyword or keyword of interest, but to the whole related set.

Thanks to this metric, it is possible to immediately understand who is the strongest competitor for the topic, the one who has made the most compelling content for Google beyond individual keyword rankings, and also to find out how much “room” there is for competition.

Traffic value

The traffic value field indicates in a nutshell how much you would have to approximately invest on Google Ads to get the same organic traffic as the site you are analyzing with SEOZoom.

The value represents an estimate based on the CPC calculation of each individual page for which the analyzed site has keywords ranked on the first page on Google.

The indication can be useful for you when analyzing competitors and trying to find possible angles to attack through promotional campaigns, or conversely to understand whether it is worthwhile to focus on (on page or off page) SEO work, to improve your site’s ranking. In theory, it can also suggest you how much you could earn through Google Adsense: if there are high CPCs, there are likely to be more display advertisers willing to invest, minding however, to look deeper into the evaluations since ADSense earnings can be very variable depending on the industry.

Volume (Vol)

Volume (abbreviated “Vol”) indicates the average monthly number of searches for a keyword: that is, it roughly corresponds to the number of times users searched for a keyword on Google in a month, on average. The “exact” keyword is taken into account and not its similar variants.

Zoom Authority (ZA)

Zoom Authority is a proprietary metric that estimates the authority of a website, with a numerical value on a logarithmic scale from 0 to 100.

The signals considered by Zoom Authority are:

  • Traffic from search engines
  • Trust (trust shown by Google toward the website in question)
  • Stability (how stable the organic ranking of the website is)
  • Opportunity (how much the website can grow in the months ahead)

Compared to other common metrics, the ZA does not take into consideration the (assumed) number and quality of backlinks or other “manipulable” signals, but is based on empirical observation of how Google behaves toward a given site.

This does not mean that it is perfect or infallible, but that it certainly offers a fairly reliable and useful snapshot of a site’s value, since it looks at key aspects such as organic traffic, engagement and growth opportunities.

To make the metric more neutral, the ZA is created from simple observation of SERPs and Google’s liking of the site, and it is also constantly evolving and adapting with respect to Google’s algorithmic updates.

Zoom Opportunity (ZO)

The Zoom Opportunity is one of the metrics that make up the ZA and, to be precise, helps identify a website’s opportunities for growth based on organic ranking, with a numerical value ranging from 0 to 100 on a logarithmic scale.

Specifically, the ZO answers the question, “How likely is the site to improve ranking on a scale of zero to 100?”

To identify opportunities, we analyzed the quantity and quality of keywords not yet on the first page and the likelihood that they might someday reach it.

Every website does indeed get traffic, has a more or less stable ranking based on the keywords it has managed to bring to TOP10, but it also has chances to improve its ranking and traffic over time. We felt it was important to consider this factor as an integral part of Zoom Authority to give a plus to promising websites over those that do not show much chance of improvement.

Zoom Stability (ZS)

Zoom Stability is one of the metrics that make up the ZA and represents the value, expressed numerically from 0 to 100 on a logarithmic scale, of the stability of the examined site’s organic ranking.

The metric answers a simple question, “How stable is the site’s organic ranking from zero to 100?”

Assessing a website only by its traffic would be superficial and biased, which is why we studied the Zoom Stability, which instead assesses the stability of this traffic.

A website with a stable ranking can rely on many keywords placed on the first page and in high positions: if even a few keywords were to lose ranking, the website’s traffic would not collapse completely, turning out to be literally stable.

On the contrary, a website that also has high traffic, but actually has only a handful of top high-volume keywords in Google’s TOP10, is more exposed to collapse risks since, losing rankings for a strong keyword, it would also see its overall traffic figure drop sharply, which is precisely a sign of poor ranking stability

Zoom Trust (ZT)

Zoom Trust is one of the metrics that make up the ZA and, specifically, it numerically estimates on a logarithmic scale from 0-100 how much Google is trusting the site in question, rewarding its pages with visibility positions over its competitors or, conversely, preferring the content of other sites.

To be precise, then, the ZT value answers the question, “How much does Google trust this site from zero to 100?”

This metric has a strictly analytical basis: to understand how and how much Google is rewarding a website in ranking, we examined the rankings of all domains in our database and compared them with each other, summarizing the answer in a single value, which expresses precisely Google’s “trust.”

Read More > here

Ranking

The Ranking section can be very useful if you want to quickly verify the ranking of specific keywords for a single or multiple at once specific domain/s.

analyze ranking

If you type the domains to be verified in the box on the left and the keywords on the right, you can find out the ranking of the domain/s for that specific keyword/s. After clicking on Analyze, you will get a result like the following (it is obviously going to differ based on entered domain and keyword):

ranking analyzed

Keywords

If you wish to analyze a specific keyword, simply type it in the top bar and click on “Analyze”. First data you will get as results will be the monthly search volume and indexed pages, the competitors and the keyword trends in SERP. Besides that, you will be able to see correlated keywords as well as the ones with same search intent.

In the first box you can see the Keyword Difficulty, a parameter with a value arranged on a 0-100 scale helping you to understand the difficulty to rank in that specific SERP.

Then you will find Keyword Opportunity, a SEOZoom metric designed to help you assess the possibilities of ranking in TOP 10 for a keyword. This metrics considers the following elements:

1) Trust of competitors in TOP 10 (Keyword Difficulty)
2) Level of optimization of the pages in TOP 10 for this specific keyword.

After that, you will see the estimated traffic volume of monthly searches. Right under this piece of data, in brackets, there are the estimated minimum and maximum values according to seasonality.

The next box includes the number of indexed pages for the entered keyword. You also have average CPC and, below, a value from 0 to 100 provided by Google Adwords indicating the level of competition among Adwords advertisements.

Below these data, you will find a preview of up to 100 results of the SERP. By clicking on a specific result, in the table on the right you will see the referring trend relative to the analyzed keyword.

Scrolling down you will find another table showing the search interest according to Google Trend. And lastly, on the its right, there is a preview of SERP advertisements and advertisement monthly trends.

SEARCH INTENT SECTION

In the SEARCH INTENT section the innovative SEOZoom algorithm manages to recognize if the analyzed keyword is, in fact, the main keyword of the focus or rather not.

In the case of the keyword “Classic apple pie” the algorithm indicates that it is not actually a Main Key, meaning that it is not useful to focus an entire article on it in order for you to make it rank on Google, as all it takes to place our content for this keyword is an article based on the true Main Keyword “Apple pie”.

Inside the four following boxes we can find very important info that will be further deepened later on the page.

    1. Keyword with same Intent
      The number of keywords we could place in TOP10 with a single article on the Main Keyword
    2. Main Intent total volume
      The total search volume we could compete for with a single article, the one based on the main keyword.
    3. Detected topics
      The number of relevant terms detected while analyzing all keywords. They represent some important focus to take into account in the article.
    4. Secondary topics
      Are all the keywords not recommended to put in the main article, as search engines actually prefer specific pages on the topic and not the main article written for the Main Key.

In the ANALYZE KEYWORD section, you will find two more dashboards.

The Competitor Analysis section includes values about the average optimization of the URLs ranked in the first 10 positions for the keyword analyzed.

By scrolling down, for each URL in SERP you can see several pieces of data and an overall score depending on – and resulting from – the sum of the single scores. Furthermore, right on top of the single scores you will find data to optimize title, description and headers according to the analyzed keyword, while below them there are three colored boxes reporting the total number of words found inside the block identified as main content (the blue one), and the number of internal and external links within the main content (green and orange one).

Inside the Related Keywords dashboard, you will find two different tables. In the first one, Correlated Keywords, there is a series of keywords with the same root of the one you are currently analyzing. Keyword with the Same Search Intent, instead, is a tool intercepting search intents: it returns what the user expects to find whenever searching for the specific keyword you are analyzing.


Web Page

Through this tool you can analyze a specific URL and know in detail the number of keywords the page is ranked for, the estimated monthly traffic, the keyword distribution, the URL performance over time and ADs coverage (indicating an evaluation of the potential monetization with Google AdSense, thanks to ADs coverage). Among values you will find PZA – Page Zoom Authority: a value from 0 to 100 representing the authority of the page on the basis of a combination of elements, such as number of keywords ranked in the first page, potential keywords and traffic volume.

In order to use this tool, you can start by manually entering an URL or clicking on the Magic Wand that, starting from a keyword, allows you to select an URL choosing among the ones ranked in that SERP.

web page analysis

In the Page Text Analysis tab, there is a bar chart showing the most used keywords.

In the Info column you will see the position of the keyword, meaning if the keyword is in the title, in the main header, in the h2 and so on.

You will also have tables including long tail keywords data, a.k.a those kind of keywords made of two or more words. You can analyze the number of occurrences (how many times the keyword is present in the document) and the percentage value.

text analysis

In the Text Structure tab, you will find a wordtree of the text. There are two different representations, a graphic one – the wordtree, that is – and a textual one. 

text structure


Pay Per Click

The “Pay Per Click” section inside the project shows the advertisements in SERP for the keywords the Web site is ranked with.

If your domain competes for a specific keyword and invested on it, you will see ads of Google Adwords in SERP and the correlated payers.

Pay per Click

By scrolling down the page, you can also analyze the pie chart that includes all the advertisers on that specific keyword.

Advertisers pie chart

Website

Type the domain you would like to analyze in the bar at the top and launch the scan: this way you will be able to verify traffic trend and all the quarterly changes. Moreover, you can also check the estimated traffic and the number of ranked keywords.

From this section, just like in the Project area, you will have access to many different features: Keyword, Sectors, Organic Competitors and PPC.

analyze website screen

In addition to what you have seen in the Project area, here you have an orange button: Quick Audit. By clicking on it, you will generate a PDF file with an automatic download: this is the ideal feature to get a quick report and a first overview of the Web site.

In the “Traffic Value” box you can see the investment you should have made through Google Adwords in order to reach the same ranking you already got for free through organic traffic.

Now, if you access the PPC section, you can see whether the domain you added is investing in Google AdWords advertisements or not. If you move to the “Competitors’ PPC” section, instead, you can see who is competing in the advertisements for the keywords the Website is ranked for. Here too you can browse results till the fifth Google page.

And if you would like to know more about our Zoom Authority: read here

Editorial Plan

Editorial Plan, available from Professional subscriptions on, is a true and proper ally for those teams and companies needing to coordinate their copywriters. To access the platform you just need to click on the “Editorial Plan” menu option right from the main suite’s sidebar.

Once clicked you will be redirected on a whole new Dashboard with which it is possible to manage the editorial plan of all the sites registered as Projects on SEOZoom.

Editorial plan Dashboard

You can add your own staff of copywriters to this platform by simply inviting them via email.

how to add copys

Through a specific sended link your copy will only have access to the Copywriter section as external access, still allowing him to use all features of the advanced editorial assistant without necessarily let him in on your personal SEOZoom account. It is possible to assign an (or multiple) article to your copys both at the end of a quick Keyword Research in the “Schedule Key” section – in the top bar – or clicking on the “Schedule article” green button and selecting “Assign article to a copy”.

assign article to copy


Here is the actual window that opens up to assign the article and provide the copy with all the info he might need to successfully create the content you wish for: the article’s title, primary and secondary keywords, referring project, any possible notes you would like to specify and add, the article’s category, length and due date. Last but not least, it is up to you to decide if the copy can modify in any way the kind of keywords you originally added or not by simply switching the Yes/No button.

Beside all this, the Editorial Plan is very useful both to have a global and constant view on the activities of the entire editorial staff through the Calendar, as you can see below

Editorial Calendar

And, most of all, to keep track of the performance of the work performed on each project – so to find out where to intervene or invest the most – and on the performance of each copywriter.

Performance tracker