Home Dashboard

After logging into the suite, SEOZoom greets you with a dashboard full of controls and features, allowing you to keep track of the level of use of the resources provided by your subscription and already have some useful insights into the projects you create.

Specifically, in the top bar you can view the list of favorite keywords (the keywords you encounter during your analyses and want to save for possible future use or insights), change the reference database (and thus whether to set the analyses on Google UK or on the foreign versions of the search engine that are available), check the latest events related to the saved projects, and browse among the projects themselves.

Events, in particular, are useful for keeping an immediate eye on the variations (positive or negative) of the keywords you monitor in a project: in practice, SEOZoom notifies you that one of the keywords you have indicated as a priority for your strategy has just entered (or has just left) the TOP10 on Google, and shows you the detail of the variation and the main search data of the keyword itself.

A quick aside about favorite keywords: adding to this “notepad” is one of three options you have for saving keywords. In fact, in each and every keyword table you find in SEOZoom, you can click on the + button to automatically add the keyword to a project, to a specific keyword research, or, indeed, to your favorite keywords cart. You can set your preferred destination by clicking on the little arrows icon at the top of the left side menu and change the default insertion mode if you need to.

Moving to the middle part of the page, you can customize this home screen by choosing tools, features, and charts that you use most often and are most useful for your activities.

Just click on the label that appears on the right to open the customization menu and configure SEOZoom around your needs. You can choose which widgets to display in the dashboard from the ones available and remove the ones you need the least, so you can compose the screen in the way you really think best suits your way of working.

For example, you can add Domain Trending or Keyword Distribution charts, but also insert widgets that allow you to immediately use certain features such as Keyword Infinity, Analyze Keyword List or SERP Comparator.

Small note: you can insert some widgets multiple times, especially those related to projects, because this way you can immediately keep tabs on multiple sites you have in your project or projects located in other international databases (even while operating on your preferred DB).

In addition, you can choose your preferred sorting of widgets, simply moving them through the drag-and-drop system and removing those you find less useful by clicking on the red button with the X.

In the “Quick Links” field, on the other hand, you can configure quick links to sections or features within Projects, such as Keyword Studio, Page Performance, or Spider Scan Details. To customize the links you must first select the project, and you can set up these links for each of your projects in SEOZoom.

Just remember to save your changes once completed!

SEO Checklist

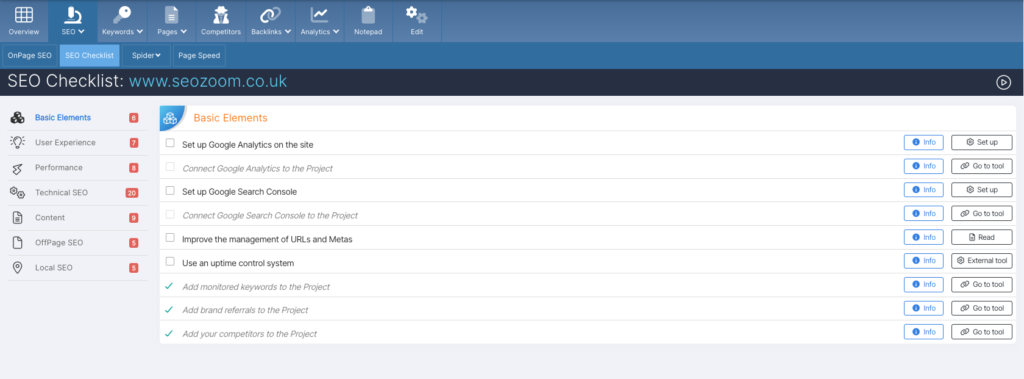
The SEO Checklist section presents a list of actions and checks to guide you through the development of an SEO project, keeping note of everything you have already done and what remains pending.

The SEO work has been categorized starting with all the basic checks you need to do on any website, such as setting up Google Search Console, Google Analytics, and other basic prerequisites to get off on the right foot.

For each element of the SEO Checklist there are two buttons: clicking on “Info” opens a window explaining the relevant topic, while the second button varies depending on the type of activity, and in some cases it might suggest an action on an external page, such as to configure Google Analytics, or refer to the specific section of SEOZoom to take direct action on the point under analysis.

SEO Page Speed

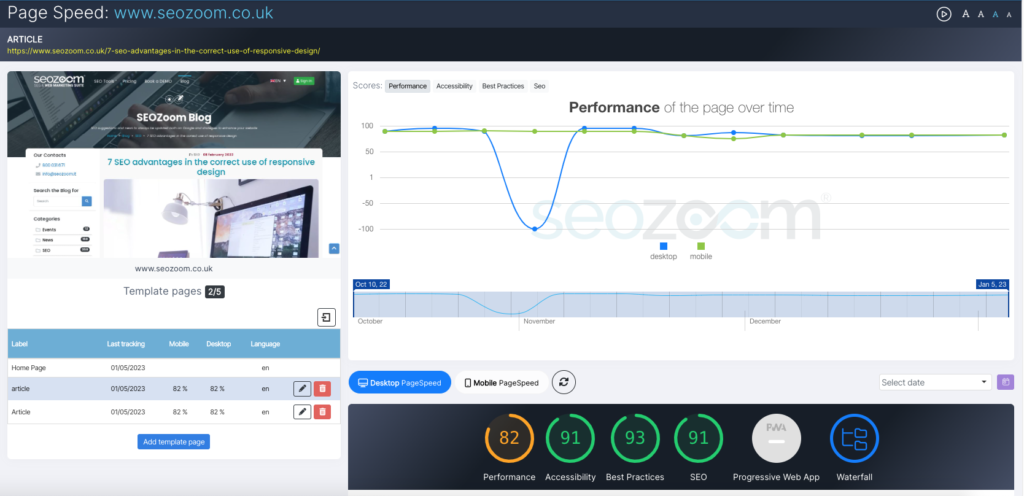
The Page Speed section allows you to check the behavior of your site against some of the main parameters that refer to technical performance, based on static monitoring on a weekly basis of the values detected by the Google Lighthouse tool. To be precise, SEOZoom crawls your site through our servers located in Italy, applying the rules that Google provides to evaluate performance and used, precisely, to compose the Lighthouse report, which can be found in the developer tools section of Google Chrome.

In particular, within the Performance section you can perform an analysis on the speed of the website’s Home Page, with all the information to improve the responsiveness of the online project thanks to an evaluation on a 100 basis.

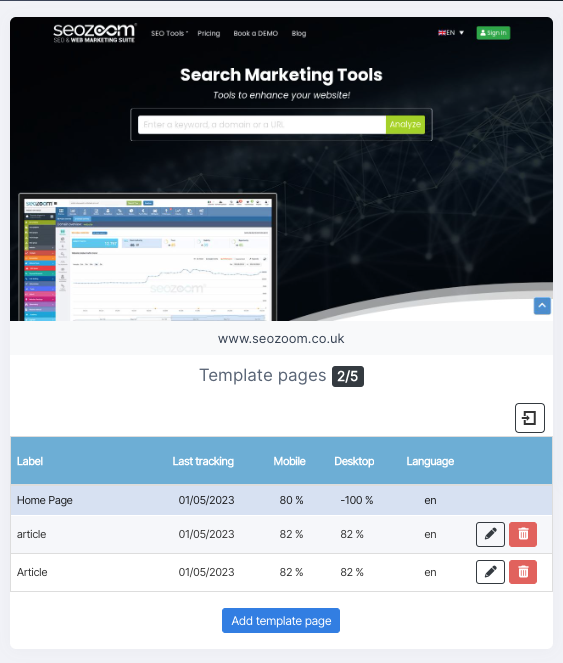
After clicking on “Page Speed” you will be presented with a dashboard that shows a preview of the Project site on the left and, immediately below, allows you to add more template pages to analyze. On the right, however, a graph appears showing the site’s performance over time, with various tabs that allow you to deepen the analysis.

Also on the right, immediately below the graph, SEOZoom provides you with a more in-depth PageSpeed analysis on some crucial performance aspects, available for both desktop and mobile versions of the site.

Here is an example screenshot:

By browsing the submenu you can get more information, statistics and optimization tips for speed and performance of your website, with particular reference to the values of the Core Web Vitals, technical parameters that Google considers in the overall Page Experience as a ranking factor to determine page rankings.

You can also ask SEOZoom to monitor up to five page types: just click on “Add template Page” and indicate the page type and URL on which to run speed and usability tests.

Page template (type) means, for example:

  • Category page
  • TAG page
  • Single product page
  • Article page

In this way, you can analyze the speed of each type of page template on the website; after you load the page, the engine scans it as soon as possible and stores the performance trend over time.

Notepad

With this feature you can simply write notes that will help you keep track of information, updates or other notes that you may need during optimization work.

You can add a note from this specific section or from some of the charts and sections within Project (e.g., the Project/Domain Overview chart and the Pages section).

Analyze Keyword

To launch a keyword analysis you simply have to type the keyword you are interested in in the top bar and click on “Analyze” or press enter from your keyboard.

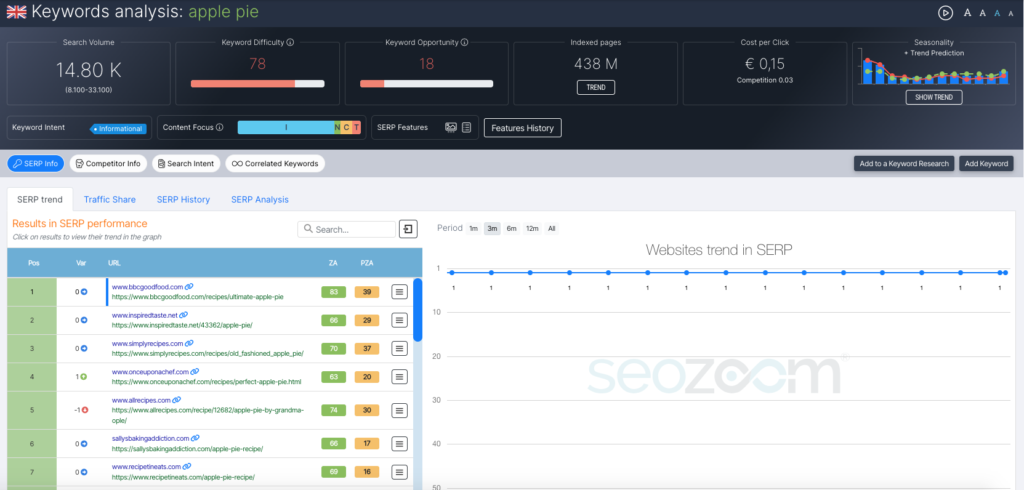
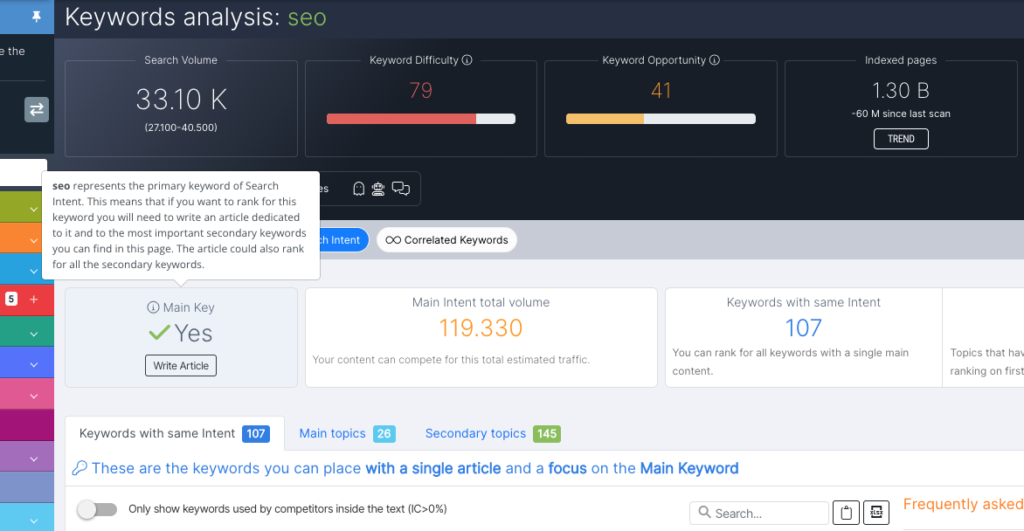
At the top of the screen you will immediately be able to read some useful data, summarizing the main strategic information related to the keyword, namely its monthly search volume, estimated Keyword Difficulty and Keyword Opportunity, total number of indexed pages, cost per click and seasonality.

Specifically, the first box reports the figure for average monthly search volume, showing in parentheses the range of variation related to seasonality (minimum and maximum value that the volume can reach based precisely on the different times of the year).

This is followed by two boxes related to SEOZoom’s two keyword metrics, Keyword Difficulty and Keyword Opportunity, both of which are characterized by a color scale that makes it easier and faster to understand the data.

Keyword Difficulty represents an estimate of the difficulty of ranking in SERPs for the keyword under consideration compared to the level of competition among the domains in TOP10. It ranges from 0 to 100, with the highest value signaling the greatest difficulty of ranking for that keyword; the metric analyzes the sites ranked in SERP for that keyword and their ZA: the more competitive the sites, the greater the difficulty of ranking.

Keyword Opportunity, on the other hand, helps you assess how many opportunities you have to rank in TOP10 on Google for the keyword analyzed: it takes into account two factors, namely the Trust of competitors and the level of optimization of pages that are in TOP10 for that specific keyword. This metric also ranges from 0 to 100, and a high value means there are more opportunities to attack the SERP and rank highly.

The next box shows the number of Indexed Pages for the keyword entered and the quantitative change since last scan: clicking on Trend opens a pop-up graph that allows you to follow the evolution of indexed pages over time. To the right is then a box indicating the average CPC, from which you can also access the trend graph with the number of ads on the first page (a value provided by Google Ads and ranging between 0 and 1, which indicates the level of competition present among Google Ads).

This dashboard concludes with the Seasonality box, which reports the historical monthly change in the search volume of the keyword analyzed and also reports, with different color graphs, the previous year’s trend and the value estimated by Zoom Trends, which you need in order to know what the current search trend really is. By clicking on Show Trend you can deepen the trend analysis, activating a pop-up graph that shows you the detail of the search volume in the average year, again with the graphical representation of the estimated volumes in real time.

Immediately below you will also find quick information about the keyword’s main search intent type (Informational, Navigational, Commercial, Transactional) and the box dedicated to Content Focus analysis. This metric shows the percentage distribution of search intent of users interested in that particular content and is derived from the analysis of the pages of competitors positioned in the top10 on Google and the intent of all keywords satisfied by their pages. Please note: the sum of the percentages may not be 100%, but this is normal since the same keyword can also have multiple search intent.

The box showing any SERP Features on the search results page follows.

In the central part of the page you can notice four different tabs: SERP Info, Competitor Info, Search Intent, and Correlated Keywords, which activate the display of specific insights. Further to the right you will find buttons that allow you to add the keyword under consideration to your Keyword Research or Keyword list (depending on the insertion mode you have set).

SERP Info

By clicking on SERP info you can immediately see the SERP Trend, which is a list of the first 50 results placed in the SERP related to the keyword under consideration, with an indication of the placed URL, ZA value of the domain, PZA of the URL, change in ranking compared to the previous scan, and the ability to perform URL Actions and Domain Actions through the hamburger menu. By clicking on the various placed sites you can activate the visualization in the graph Websites Trend in SERP, which shows you precisely the ranking trend of the different pages with respect to the entered keyword.

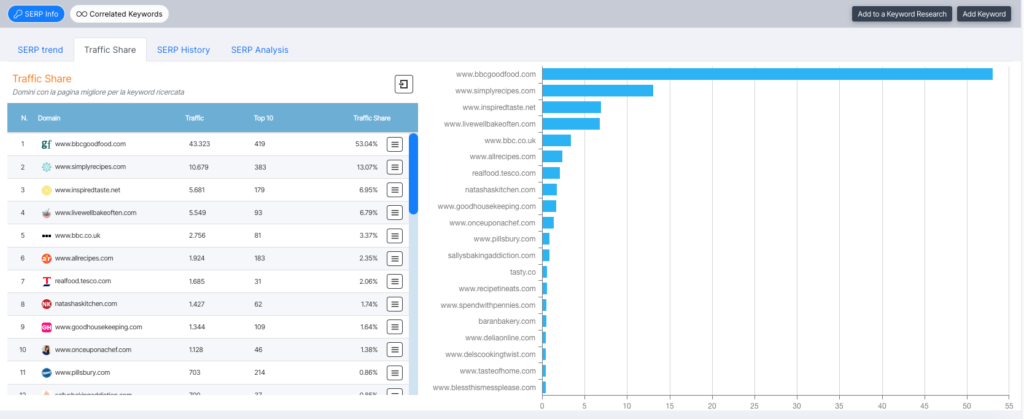
The second function allows you to analyze Traffic Share, which is the percentage distribution of the total traffic generated by the entire cluster of keywords that refer to the search intent, thus extending the analysis not only to the main or inserted keyword, but to the entire related set. In this way, you can quickly visualize which domains have the best page for the searched keyword, those that have produced the most compelling content for Google.

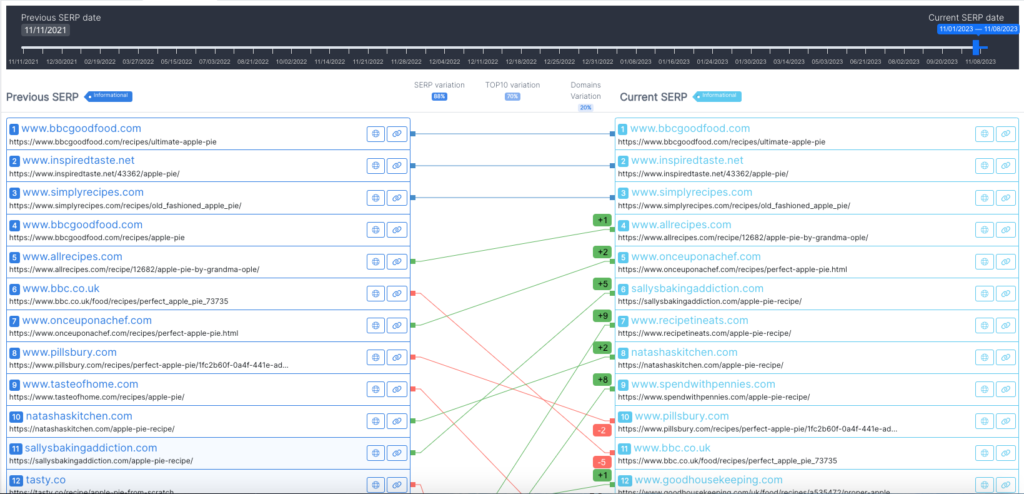
Closely follows the SERP History tab for the keyword under analysis, setting the date to compare SERPs over time and the possibility to launch a domain or URL analysis. In addition, SEOZoom also reports to you the level of SERP variability compared to previous scan, showing you the percentage value of SERP variation, of only the TOP10 results and positioned Domains.

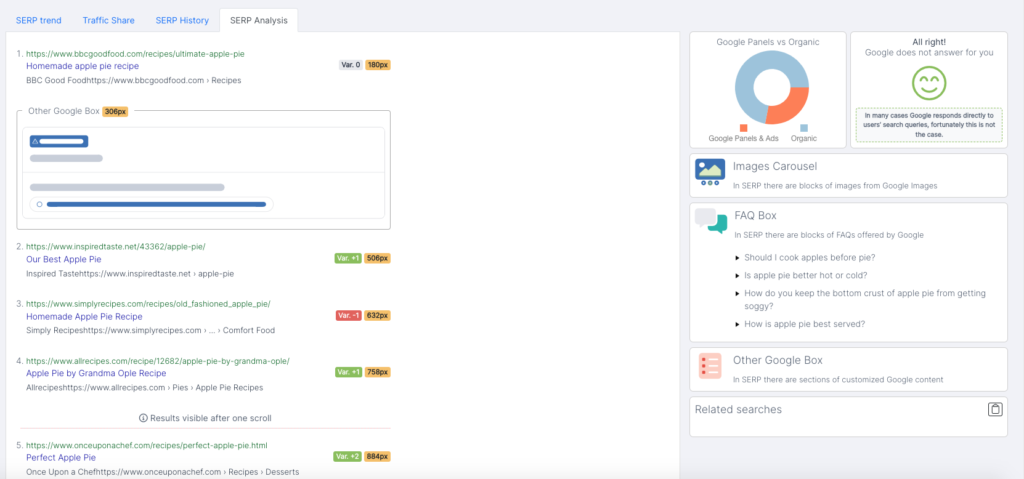
With SERP Analysis, on the other hand, you can get even more timely and in-depth information about the composition of Google’s search results page for the keyword under consideration. SEOZoom describes to you the structure of the SERP, pointing out the presence of any Google boxes and features and the precise position they occupy on the page (showing the number of pixels from the top), and proposing the same information for all the elements that make up the page, thus including the organic results; in addition, you can also find out which results are above the fold and which are only visible after a scroll, so you can begin to actually assess the organic competitiveness of the SERP and make informed assessments regarding strategic opportunities to work on the keyword for your site.

On the right side of the screen you can display other information you might need for your strategies, such as the relationship between Google elements (Google Panels) and organic results on the page, the possible presence of a direct response from Google and list of all SERP features triggered by the keyword, such as an Image Carousel, Frequently Asked Questions Box (also showing the questions present, which can also be used for targeted content creation, for instance), results from Google News, Local Search map, videos from YouTube and so on, up until the box with related searches that Google suggests to its users, still in relation to the analyzed keyword.

Competitor Info

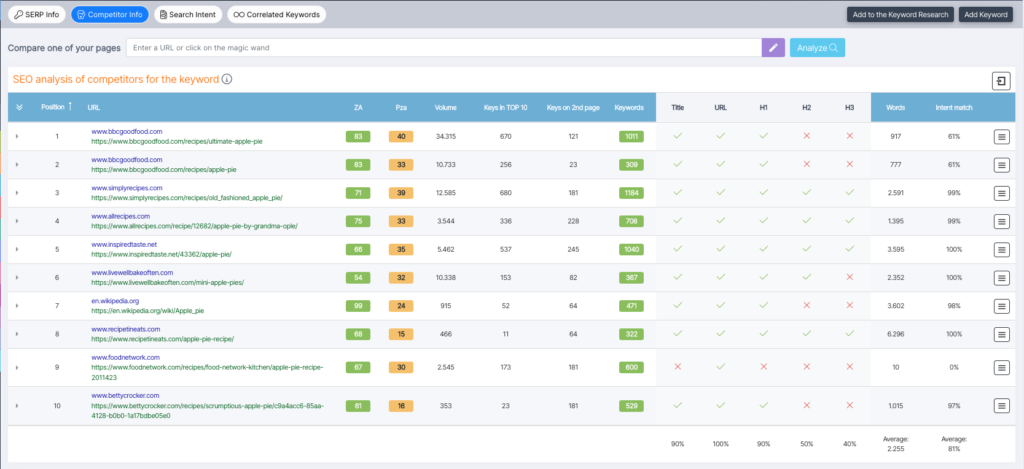
With the Competitor Info section SEOZoom provides you with a real time analysis of the URLs positioned in TOP10 for the keyword under analysis, with the possibility to indicate a URL of your choice to compare it with those present.

In the central table you can read all the useful information for the positioned web pages, and in particular the ZA, the Page Zoom Authority, the estimated monthly traffic volume, the number of kws in the top ten and on the second page, as well as the total number of keywords ranked. This is followed by some indications related to the level of optimization of the page and its content, which allow us to find out at a glance whether the keyword under consideration was used in the Title, URL, H1, H2 and H3, and then the data of total number of words present in the main content and intent match percentage, as well as the hamburger menu to launch URL Actions.

When you click on the arrow at the beginning of the individual row, you activate the SEO analysis for that page, which presents you with in-depth data on the level of optimization of its content. Specifically, you can view a box focused on Search Intent, which analyzes the text of the content to determine the value of Intent Match, Topic used, and Relevant Keyword; the lower box, on the other hand, shows what title and meta description you have set, and even further below you find the page’s optimization level estimated by SEOZoom for the various parameters.

On the right, instead, you have access to three different tabs: the first gives you an overview of SEO Optimizations, pointing out which best practices have been met and which are the issues in the examined URL with respect to content management. This information is especially useful when comparing your URL with competitor pages, because it allows you to understand if and how much the competitors positioned in TOP10 have optimized pages, and to consequently set a more targeted strategy to climb the SERP.

The Use of Keyword inside Tags tab allows you to analyze in detail how much and where the keyword under consideration is used in the content tags, and thus in title, H1 header, anchors for any links, and image alt text.

Lastly, you can also find out if keywords that refer to the same search intent and have search volume are used in the text.

Search Intent

The Search Intent section represents the heart of keyword analysis, because it goes beyond the classic values and metrics of the single keyword to delve precisely into the search intent, the search intention of users identified by Google, an increasingly central aspect in the most modern SEO and keyword research activities.

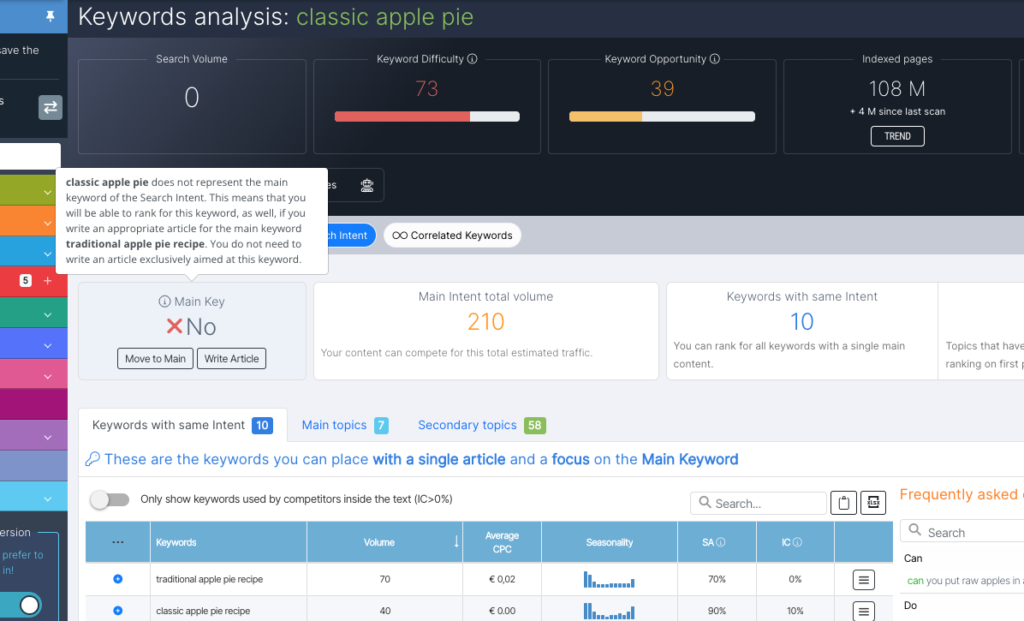
SEOZoom’s innovative algorithm is able to first identify whether the keyword being analyzed is the main keyword of the focus or not (and gives you the ability to immediately set up an article with the keyword under consideration).

In the case of the keyword “seo”, for example, the algorithm indicates that it is a Main Key. Conversely, if you analyze a keyword such as “Classic Apple Pie“, the algorithm indicates that it is not a Main Key, thus suggesting that you focus your content on the Main Keyword, which we can discover by clicking on “Move to Main” (in this case, it is “Apple Pie”).

On a general level, it would be preferable to set an article on the Main Keywords to increase the chances of ranking on Google, but this does not mean that it is not possible to continue working on optimizing content for a secondary keyword or a very specific long tail keyword, depending on the cases and contexts.

In the next four boxes we find very important information that will then be discussed in more detail further down the page, and that analyze the keyword not as a single entity, but as an element of a cluster of keywords afferent to the same intent.

  • Total Main Intent Volume

The total search volume for which you can potentially compete with a single article, calculated on all keywords included in the main search intent.

  • Keywords with the same Intent

The total number of keywords with the same search intent as the main keyword.

  • Main Topics

The number of relevant topics identified by analyzing the content of sites in TOP10: they represent some important focuses to be considered in the article.

  • Secondary Topics

These are all the keywords and topics related to the intent, but which you should take into account to write related in-depth articles, since search engines are preferring topic-specific pages and a general article focused on the Main Key.

You can elaborate on these three aspects – Keyword with same Intent, Main Topics, Secondary Topics – in the appropriate tables, which provide you with a series of valuable information for your content strategy.

The first table lists keywords with the same search intent, those you can potentially place with a single article focused on the Main Keyword, indicating for each its search volume, average CPC, seasonality, and two innovative metrics: SERP affinity and In Content. The SA tells you how similar the SERP of the term you are analyzing is to that of the Main Keyword, expressing a percentage value from 0 to 100: in practice, it tells you how many results in common there are between the two SERPs. The “In content” value refers to the percentage of competitors positioned in TOP10 who used the row keyword within their content. With the filters and additional features you can also set custom views, for example, “discarding” keywords not used by competitors (those with IC equal to 0) or sorting the keys by the SA column. Moreover, on the right side you will find the Frequently Asked Questions from users about the topic, which can become suggestions that you can leverage for content creation.

You can then move on to the analysis of the main topics, listed by concept and relevant term in the table on the left, where you can also check the number of correlated keywords, potential traffic volume, and SA and IC values. For each topic you can delve deeper into what relevant keywords are identified by SZ, which in the right table informs you about the corresponding values of search volume, average CPC, seasonality, SA and IC, so as to give you all the insights to create strategic content and organize the keywords.

The last table is dedicated to secondary topics, with a list of keywords with which you could deepen the main topic with related articles that offer a different focus on it, to be taken into account when creating an internal link structure. In this case, the table shows all identified secondary keywords, with an indication of the corresponding average search volume, number of keywords that pertain to this intent, and consequent potential volume that you can reach with a tailored article.

Correlated Keywords

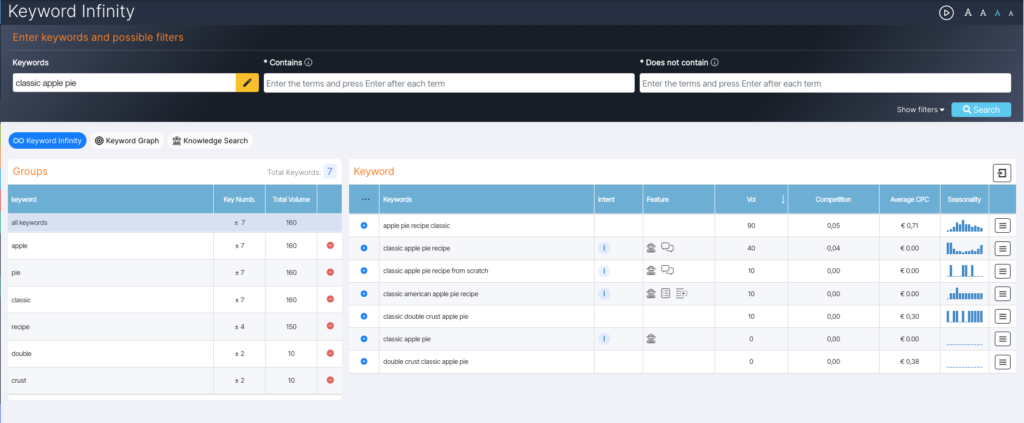
The keyword analysis is completed with a fourth tab, Correlated Keywords, which sends you directly to the Keyword Infinity tool, already set up on the analysis of the keyword you are interested in and with the possibility, therefore, to deepen this term with all the features you have available in this section .

Analyze Website

Type in the bar the domain you want to analyze, press enter or click on Analyze: in this way you get a complete panoramic snapshot of the site’s performance on Google, with lots of useful information to study an organic competitor or any site of your interest.
In addition to the information in the dashboard, you can also focus your analysis on four more specific areas, as is the case of the projects area, and then access the Sectors, Keywords, Pages and Organic Competitors features.

Website Analysis is the first screen that summarizes the behavior of the analyzed domain on Google.

It is good to know that you can also export the data shown, by clicking on the PDF icon or the Quick Audit button. In the first case, SEOZoom quickly and automatically generates a site report, a file that simply shows the data from the tables, while Quick Audit (available from the Professional plan up) is a more detailed tool, which takes the form of a real SEO analysis of the site. In fact, the self-generated document also walks you through the insights, providing useful hints to understand what the values shown mean and, therefore, to quickly assess the site as a whole.

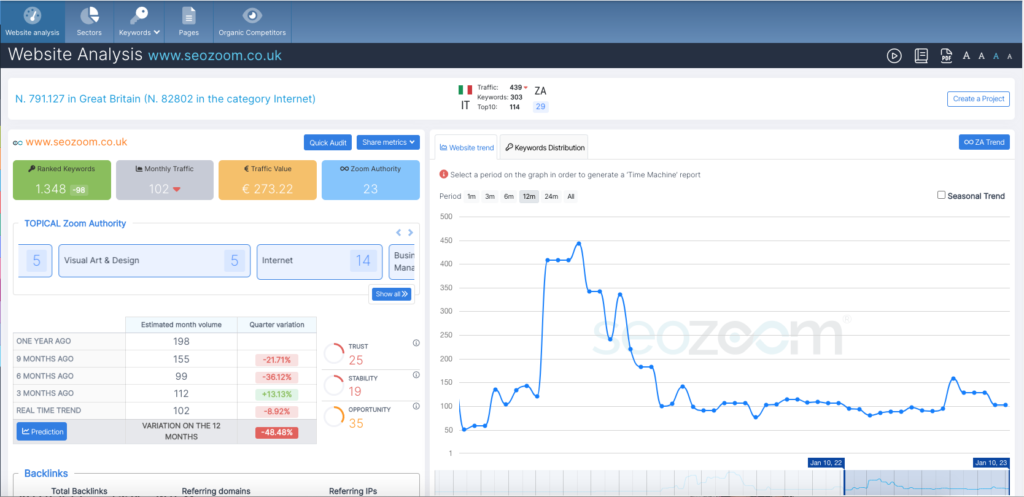
Going back to data and tables, the first information you find in Website Analysis is the domain’s position in the overall ranking of UK sites (or whatever other database you are currently using for your analysis) and in its main category of relevance. Moreover, if the site you are analyzing also manages to compete on the international versions of Google tracked by SEOZoom, here you can read a summary report of its performance, and in particular its traffic volume (with an arrow quickly indicating the trend), number of keywords placed, number of keywords present in TOP10 and Zoom Authority level, all based on that specific version of Google.

Also appearing on the same line is the “Create a Project” button, which precisely allows you to create a new project for the site under consideration; other “utilities” include those that take you to the video explanation of the section and the Manual, or that allow you to set the text size of the tables, to adapt the display to your screen, and to share metrics by generating an image file (by hiding or keeping visible the domain indication).

Delving deeper into the tool, the analysis begins with 4 colored boxes summarizing your site’s performance:

  • Ranked Keywords tells you precisely the overall amount of keywords placed on Google (with numerical variation from previous scan). Clicking on the box leads you to the Keyword Studio section, where you can further analyze the keywords of the site you are checking.
  • Monthly Traffic reports data on the estimated monthly traffic volume of the site’s pages, with a side icon that tells you whether the variation from previous scan is negative, positive, or stable. You can elaborate on this data in the table right below it, which shows you the value of the site’s monthly organic traffic volume on a quarterly basis up to one year ago, with the option, by clicking on “prediction” to also launch a predictive analysis over the next 12 months (with aggregated values or broken down on a monthly basis).
  • Traffic value indicates the investment you would have to make with Google Ads to get the same rankings that the site got with organic traffic. The figure is on a monthly basis and the value is constructed using the sum of all Ads CPC values of the individual keywords for which the site is ranking on the first page on Google.
  • Zoom Authority, which shows you the ZA value estimated by SEOZoom. By clicking on the box, you can also check the trend of this metric over time, and also analyze the changes for the other Opportunity, Stability and Trust metrics of the domain in question.

Speaking of authority, then, you can also check in detail what the site’s Topical Zoom Authority values are in all the vertical sectors the site is currently ranking in (and by clicking on “view all” you can study in detail the site’s rankings in individual categories), and also the individual level of Trust, Stability and Opportunity.

TO KNOW MORE ON AUTHORITY ZOOM AND OTHER METRICS: read here

This part of the tool closes with the Backlinks box, which summarizes the numbers of links received by the site, reporting the total, the domains hosting those links, and the amount of Referring IPs.

On the right, then, you will find a graph on the historical performance of the site, reporting to you the fluctuations in traffic volume (the metric taken on the y-axis) over time (the value on the x-axis). By viewing the individual “dots” on the graph, which are SEOZoom’s scan checkpoints, you can also precisely check the date, traffic volume, and total number of keywords selected, while on the horizontal axis you will notice some Google icon symbols, which represent the dates on which relevant updates to the search engine’s algorithm were released (and you can also know more about them).

By activating “Seasonal Trend“, on the other hand, you can check on the graph for any deviation between the search volume actually achieved by the site and the one predicted by seasonality (represented by the curve filled in blue).

By manually selecting a period on the graph, you can generate a “Time Machine” report for the dates you set.

Clicking on the “Keyword Distribution” tab activates the graphical display on Google keyword rankings (vertical axis) over time (horizontal axis) for the site under consideration. In this case, SEOZoom also visually shows you the keyword distribution within the first 5 pages of the search engine, chromatically distinguished.

The data on the current distribution of keywords on Google for the examined site can also be found in the chart immediately below the table; next to it, however, you can find out which are the Main Sectors for which the domain has keywords positioned, with a chart showing you the percentage distribution of traffic over only the top 5 verticals of greatest relevance.

This is followed by 3 charts that anticipate the detail on the site’s keyword analysis, specifically:

  • Best Keywords, which shows the top 10 keywords ranked by search volume, usually those that are in the TOP10 on Google and thus provide the most substantial contribution to site traffic.
  • Important rising keywords, which lists the top 10 keywords, based on search volume, that have experienced a positive variation since previous scan.
  • Important dropping keywords, which reports the top 10 keywords, based on search volume, that have experienced a negative variation since previous scan.

All three tables present detailed information about the keywords, such as their ranking position, any change from previous rank, search volume, estimated current visits generated by the keyword, and variations from previous scan (only for important rising or dropping keywords), KD and KO level. By clicking on the hamburger menu at the end of each row you can activate Keyword Actions, while the “view all” button allows you to check the detail of the examined keywords within the relevant section of Keyword Studio.

The last part of the Website Analysis dashboard focuses on the analysis of the entered domain’s competitors, automatically identified by SEOZoom.

Specifically, the Organic Competitors table shows a list of websites that compete for the same keywords as the analyzed site: the various columns allow you to find out the level of competitiveness (the percentage of keywords in common between the site under review and the competitor domain – to exemplify, if the level is 100, it means that the competitor site appears in all the SERPs in which the analyzed site also appears); the ZA, the keywords ranked, the Top Keywords in common (the keywords with higher search volume and ranking for which both sites compete), the traffic trend (with respect to the two time checkpoints, with quantitative indication of the actual change), the estimated search volume of the two sites, and the difference between the two values. Closing the row is the hamburger menu, which leads you to the domain actions with which to further study the competitor site.

The Main Competitors Estimate graph basically shows you the previous information except now in visual form, distributing the competitors (represented by circles of a diameter that is proportional to traffic value) in relation to traffic value (vertical axis) and total keywords (horizontal axis).

Sectors

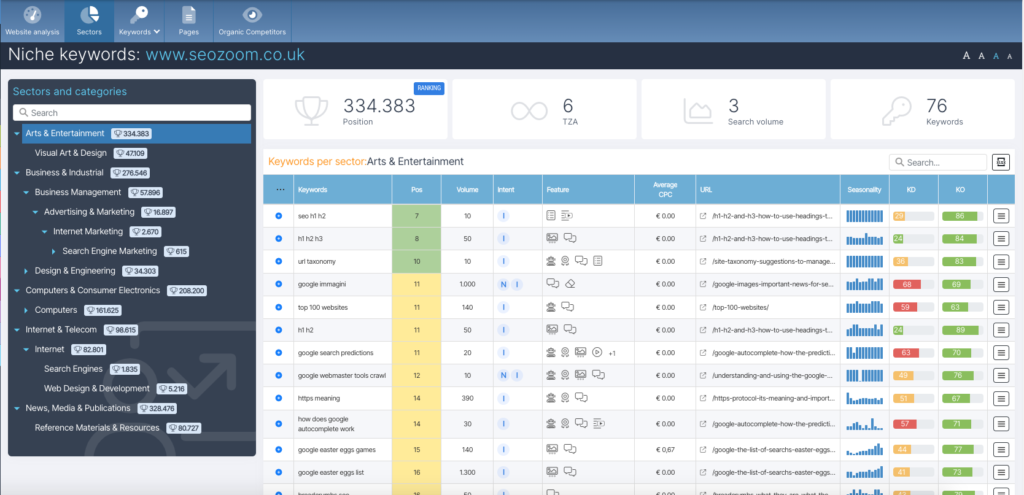
The Sectors tab allows you to instantly get a strategic overview of the keywords for which a particular website is positioned in each sector identified by Google, with a range of data and information to further your study.

The tool displays a dashboard divided into three parts.

The table on the left shows the sectors and categories recognized by Google for which the domain has placed keywords, as well as the domain’s position in that ranking.

In the table on the right, called Keywords per Sector, you can check precisely the list of all keywords related to the previously selected category. For each keyword you can read its SERP position, average search volume, intent type, presence of SERP Features, CPC value, URL of the positioned page, seasonality, keyword difficulty and keyword opportunity values, and by clicking on the hamburger menu you can access the Keyword Actions and URL Actions functions.

The highlighted boxes above the table, on the other hand, show the site’s crucial information for the selected category: Ranking Position, Topical Zoom Authority, Total Search Volume of all keywords placed in that sector, Total Number of Keywords placed in the sector.

Keywords

The Keywords section available from “Domain Analysis” allows you to delve into the main aspects related to the analysis of the keywords on which the site competes, and in particular to find out which keywords are the best and potential ones, to know the ones that are rising, falling, those that have entered or left the TOP10, up to viewing all the keywords for which the domain you are studying is positioned.

In much the same way as with a project site, SEOZoom allows you to use the Keyword Studio features, which are the heart of our keyword study tools.

From the main dashboard start different path of analysis, different visualizations and tables that keep you up-to-date on the Keyword trend of the analyzed site.

To be precise, you will find 7 different study angles, namely:

  • Ranked Keywords.
  • Traffic Increases.
  • Traffic Drops.
  • Potential Keywords.
  • Featured Snippets.
  • SERP features.
  • All site keywords.

For the analytical description of the different visualizations, we refer you to the similar Keyword Studio feature in the Projects area (compared to which, in this section, only Keyword Branded is missing, related to the brand setting in the project itself).

Pages

With the Pages section you can analyze, monitor and understand the level of optimization of the web pages of the site you are analyzing through a number of different functions and “angles.”

Specifically, the dashboard allows you to immediately view the list of the best pages on the site, those that are making the greatest contribution in terms of traffic and that have the most keywords in TOP10

For each URL, the estimated monthly volume figure and the number of keywords placed is shown.

By selecting a URL, on the right you can check other useful information, such as its PZA, traffic (potential, reachable by bringing all keywords identified to the first page, and current percentage of return compared to the total of the site), change in traffic from the previous month, and total keywords identified (in the Keywords box). Then, by clicking on Enable pages potential, you can enable the visual representation in the graph of the potential of the URL under analysis.

In the table on the bottom right, on the other hand, there are data on SERP position, ranking trend compared to previous scan, volume, average CPC, keyword difficulty, keyword opportunity, the traffic that is estimated to arrive from the various keywords, plus the hamburger menu to launch more in-depth analysis.

Through the various tabs you can deepen the analysis and view only the keywords in TOP10, Potential (i.e. positioned on the second and third page) and Distant (i.e. keywords positioned beyond the third page of Google).

SEOZoom also provides you with an additional cue by dedicating a tab to Similar Pages, i.e., pages positioned with keywords in common with the one being analyzed: in this way, you can detect cases of cannibalization and solve these problematic situations.

The last tab concerns the SEO Analysis, which you can also launch from this section to perform a quick general analysis on the level of optimization of the selected keyword, also in relation to the competitors that are getting the best results.

Organic Competitors

The competitor section is structured in a way that allows you to quickly check and compare the analyzed site data with those of direct online competitors, automatically identified by SEOZoom based on the level of keywords in common.

The functions are very similar to the homonymous section in the Projects area.

The main dashboard – General Summary – immediately shows you the list of identified competitors, with the possibility of removing one of the domains from the list or manually entering another site. To analyze the data and evaluate the different performance, you have at your disposal a series of graphs that put in “competition” the domains reported as “competitors”: the first simply reports the temporal trend of the volume of organic traffic achieved by the selected site compared to the one analyzed.

Scrolling down the page, then, you find a bar graph that shows the competition on keyword distribution (so how many keywords are placed in the first, second, third, fourth and fifth page of Google), and a bubble graph that makes more immediately visible the size level of the competitor, based in particular on traffic volume, number of keywords placed and ZA.

By clicking on the Competitors Detail tab you can continue your analysis and select a Competitor from the table on the left to activate a range of information that is useful for you to make verifications and study the best strategies. In particular, you can launch comparisons based on:

  • Content GAP: lists the Competitor’s Top keywords for which the Project site lacks content in SERP
  • Keywords in common: reports the keywords for which both domains are ranking
  • Keyword on which you are losing: indicates the keywords on which the Competitor is ranking better than the Project site
  • Keyword on which you are winning: groups the keywords on which the Project site is ranking better than the Competitor
  • Competition in TOP10: shows the keywords in TOP10 for which the two domains are in direct competition.

From all of these tabs, you can also launch more in-depth analyses on the individual keyword or related positioned URL by simply selecting one of the actions in the hamburger menu.

Analyze URL

The third mode of analysis you have at your disposal with SEOZoom, after those focused on keywords and domains, concerns a specific page through manual entry of its precise URL.

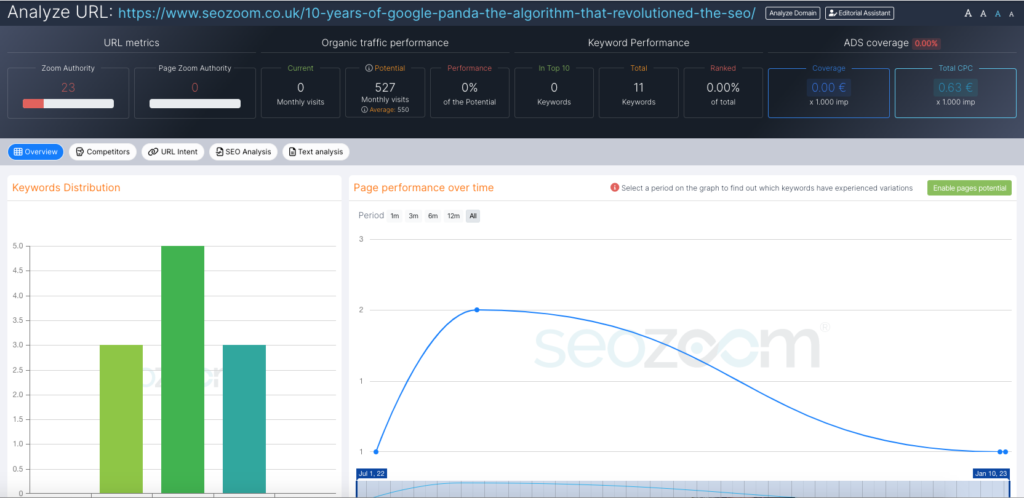
When you launch the analysis of a URL that has keywords placed on Google you immediately get an initial Dashboard that summarizes a series of useful and practical information. In fact, you can immediately know in detail a series of insights, divided into:

  • URL Metrics, to find out the values of Zoom Authority and PZA – Page Zoom Authority, the two original SEOZoom metrics that present a value from 0 to 100 and indicate the Page’s authority based on a mix of elements, including keywords ranked on the first Google page, potential keywords and traffic volume.
  • Organic Traffic Performance, a mirror that summarizes the values of current monthly visits (in green), potential visits by bringing all keywords to the first page (in orange), and current versus potential performance (red) of the analyzed URL.
  • Keyword Yield, a mirror that summarizes data on the number of keywords in TOP10 (green), total keywords in the top 50 positions (in orange), and percentage of keywords placed in TOP10 compared to the total (red).
  • ADS coverage, which helps you understand by how much the “traffic value” of the page could improve if all placed keywords made it to the first page on Google. The figure represents the percentage deviation between the two values presented in the boxes Coverage (the sum of the CPC of the keywords you have on the first page, in blue) and Total CPC (the sum of the CPC of the keywords you do not currently have on the first page, in light blue).

You now have the ability to take the analysis to a greater level of depth, thanks to several tabs that lead you to further practically examine every aspect related to the page you are interested in and also its current level of optimization.

The first section is called Overview and gives you access to the classic useful information about the ranking of the URL under analysis, and in particular to the distribution of the keywords positioned within the first 5 pages of Google, to the graphical performance of the page itself over time (with the possibility of activating Enable pages potential to enable the visual representation in the graph of the potential of the URL under analysis), to the complete list of the keywords positioned and to any pages of the same site at risk of cannibalization, since they are related to the same topic or compete on the same keywords.

Competitors

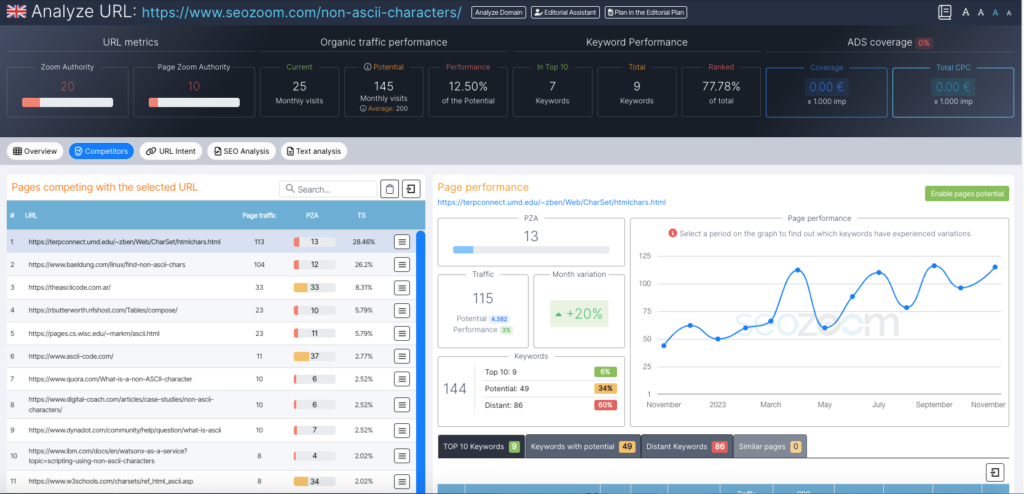
In the Competitor tab, on the other hand, you can analyze pages from other domains that compete with the one under analysis, automatically identified by SEOZoom on the basis of common keywords.

For each competitor URL you can see the estimated traffic, its PZA value and Traffic Share value (expressed as a percentage, to quickly figure out which URL is taking the most traffic from the intent keyword cluster) in the table on the left, while on the right you will find the URL analysis dashboard that allows you to deepen the analysis of the page and its performance through the “classic” boxes, graphs and tables full of information and insights.

URL Intent

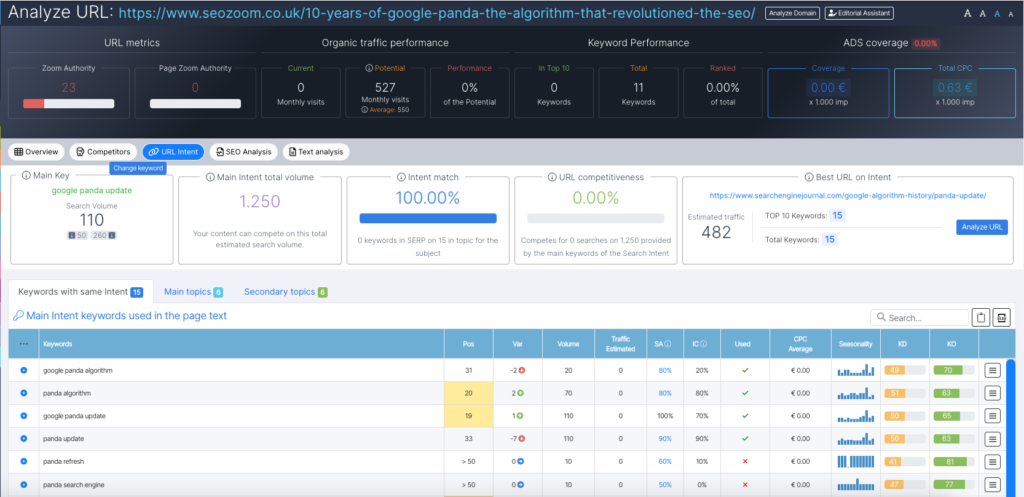
The URL Intent tab is an innovative SEOZoom feature that, thanks to its algorithm, is able to identify the main keyword of the search intent underlying the analyzed content and, in this way, study the page performance going beyond the “old” analysis systems.

In this way, you can examine the Search Intent related to the URL being analyzed, with a range of data inherent in the intent match, competitiveness, and keywords related to the topic.

The dashboard immediately shows you five boxes: the first one tells you the main keyword identified by SEOZoom (and gives you the possibility to change it manually, if you think the main keyword of that URL is another one) with its range of monthly search volume; the Total Main Intent Volume (i.e., the total search volume calculated on all the keywords pertaining to the search intent identified for the URL); the intent match percentage (how much the analyzed page matches the search intent); the URL competitiveness percentage (which indicates how competitive the analyzed page is, how much it manages to compete on all the keywords referring to the search intent); indication of the best URL for the identified intent (which indicates precisely which is the page that is getting the best performance and most traffic for the identified search intent), with estimated traffic values, number of keys in TOP10 and total number of keywords placed, as well as the chance to analyze this URL in more detail.

Immediately below you will find useful pointers related to any secondary keywords that might be worth considering in a content strategy that wants to go deeper into the topic. The table with secondary topics gives you exactly a list of keywords with which you could deepen the main topic of the analyzed page with related articles or with optimization of the already published content. In particular, SEOZoom tells you which articles are already present that should be improved, which articles only partially cross the intent, and – last but not least – which topics that are not currently covered in any article.

SEO Analysis

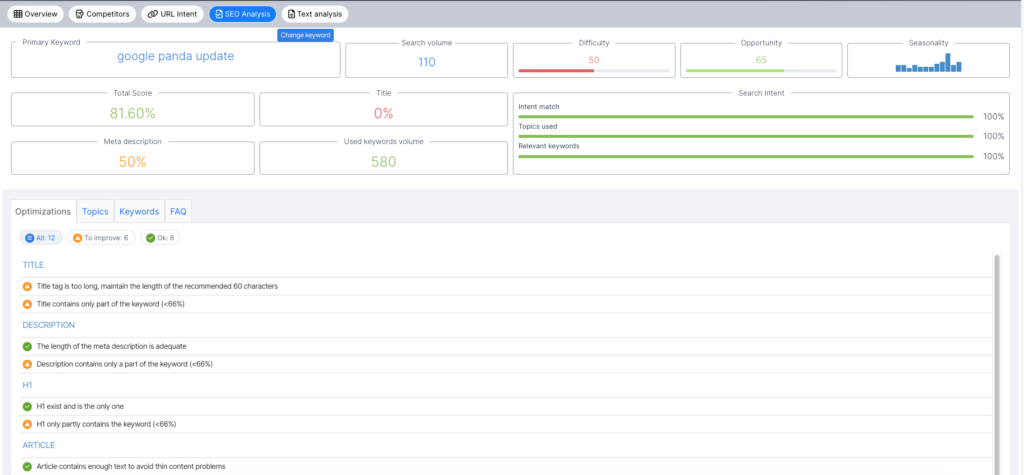
Moving to the SEO Analysis tab you get a complete analysis on the optimization of the Page in relation to the indicated key, which can also be varied in case you are interested in delving into a different keyword than the one identified by SEOZoom.

Among the various in-depth data on the level of optimization of the content you find, in particular, a box that reports the main key and its values, and then still another box focused on Search Intent, which analyzes the text of the content to determine the value of Intent Match, Topics used and Relevant Keywords, and another section that shows you what the title and meta description set are and, again, the level of optimization of the page estimated by SEOZoom for the various parameters.

This is followed by a dashboard divided into 4 tabs that allows you to really get a better understanding of the optimization level of the content of the page under consideration, with a number of suggestions divided into the sections:

  • Optimizations
  • Topics
  • Keywords
  • FAQ

In the Optimizations tab you have a summary table with points to consider in order to have a well-optimized article based on SEO best practices, both technical and structural.

In the Topics tab you have an analysis related to recurring topics related to the chosen keyword, while in Keywords you can see instead a list of other keywords potentially related to the identified target keyword, divided into All, Fundamental, Recommended, Optional, Additional, Missing. For each of them, you can select a keyword and SEOZoom analyzes for you if and how they were used by competitors, providing you with the average search volume. In the other tabs on the right (H1,H2,H3, A, IMG, Sentences), the tool scans the top 10 SERP results for the target keyword and tells you what headers, links, images, and seentences the competitors used the keyword in.

In the end, in the FAQ tab, SEOZoom brings you the users’ most frequently asked questions about the topic, as identified by Google.

Text Analysis

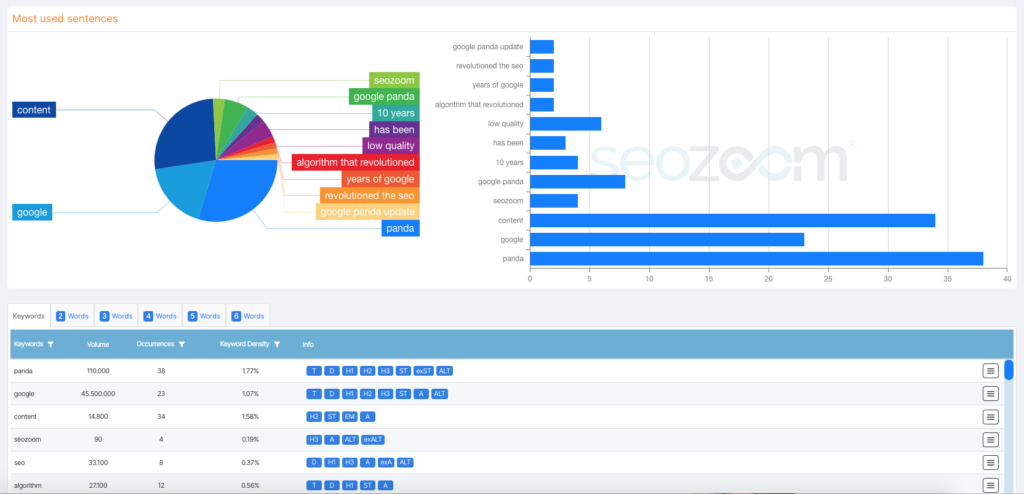
Back to the main tabs of Analyze URL, you then find Text Analysis, which gives you a graphical view of the structure of the content and thus allows you to take a look at the way keywords are used on the page. First, SEOZoom shows you a pie chart with the most used sentences, also offered in a bar graph version.

The table allows you to deepen this analysis, listing all the keywords previously highlighted, distinguished according to the keyword extension (i.e., if it consists of one word, two words, and so on, up to 6 words).

For each keyword you will find in the table information on search volume, number of occurrences on the page, percentage of keyword density (i.e., the frequency with which the term or group of terms is present in relation to the total number of words), and – in the Info column – indication of the position in the content where the keyword is present, i.e., whether, for example, it is in the title, in the main header, in the h2, and so on.

Analyze Question

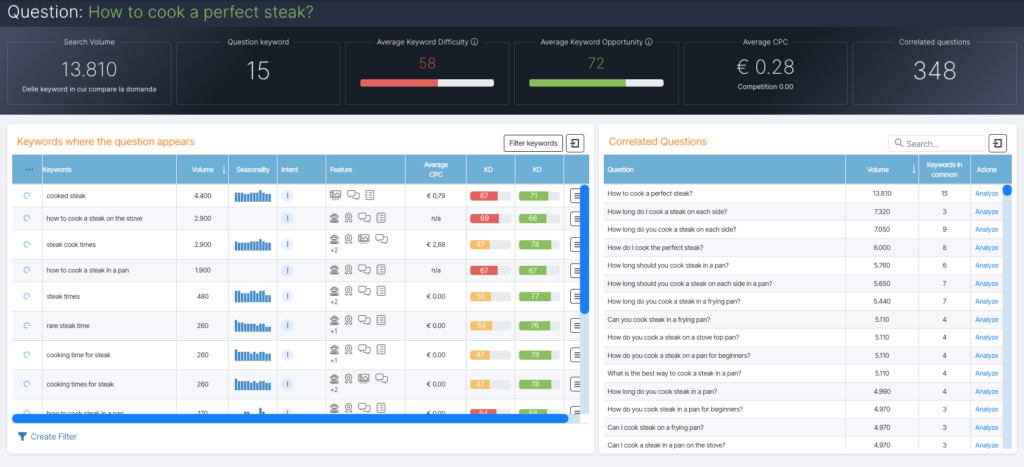
In the SEOZoom’s search bar you also have the opportunity to launch a search based on questions: when you type in a query, in fact, you can select the “Question” option from the context menu and then find out whether it is actually related to possible user queries.

By launching the analysis, you get the information about the question and the queries in which Google will presents it within its features, such as the “People also ask” box: the screen immediately shows you the total search volume of the keywords in which it appears, the total number of those keywords, the average values of KD, KO and CPC, and then the total number of related questions, i.e., the other questions that users interested in the topic usually ask and that Google then shows in its SERP.

By clicking on a new question you can delve into its data, thus discovering the total number of keywords that trigger it and so on.

Knowing the questions means understanding what the users’ true needs are and what can properly serve them, and this mode of research also allows you to identify the relevant keywords you need within your content to answer those intents in a comprehensive and useful way.

Analyze Root Domain

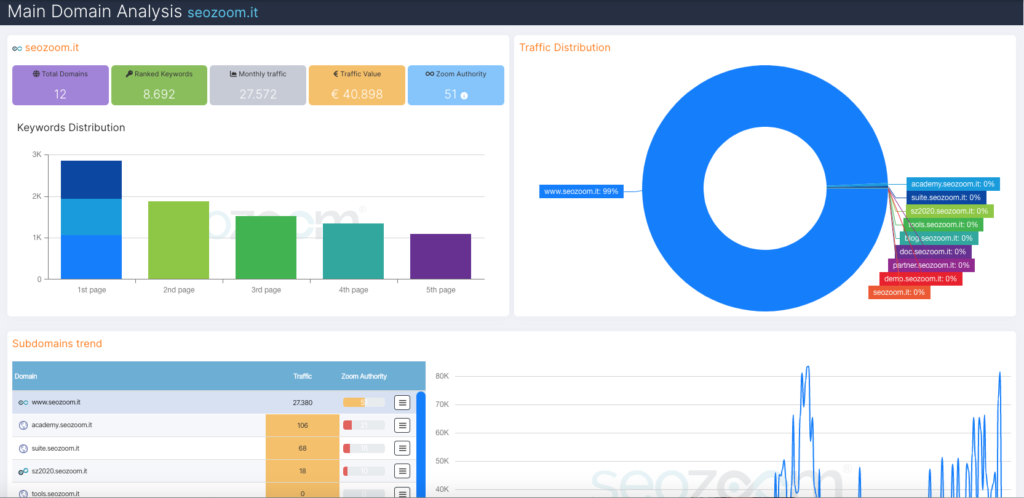
SEOZoom also allows you to analyze the Root Domain, if subdomains are present: simply enter the domain URL and, in the “Type of Search” drop-down menu, select “Root Domain”.

With this type of analysis you can get useful insights into the performance of the domain as a whole.

In the first box in the top left corner, in particular, you can read the values related to the number of total domains placed, total keywords placed, estimated total monthly traffic generated, Total Traffic Value for all domains, Zoom Authority of the Main Site. Immediately below, then, you will find the graph with the distribution of keywords placed within the first 5 pages of Google.

On the right, on the other hand, the pie chart shows you the distribution of traffic, and thus makes you understand at a glance how much each domain and subdomain contributes to the total organic traffic value of the site you are analyzing.

This is followed by a tabular list of all subdomains, from which you can also proceed to analyze an individual site, with immediate indication of traffic value and ZA, and the ability to go even deeper with the Domain Actions that you can activate from the hamburger menu. By selecting a single value from this table, you change the view of the graph on the left, which shows you the subdomain’s traffic trend over the time frame available.

Finally, as you scroll down the page you find a series of individual “boxes” dedicated to all the subdomains afferent to the analyzed site: of each you can preview the homepage and information on total keywords, estimated traffic value, estimated traffic quantity figure, Zoom Authority level, and percentage of traffic generated compared to the total site.

Editorial Plan Management

Even in the most modern approach to SEO, content remains a decisive aspect of achieving good search engine rankings, as Google never fails to remind us, regardless of the type of website: whether it is an eCommerce product sheet or a news article, the content must always try to meet the specific needs of users without going off the track of what is already appreciated and rewarded by the search engine.

Underlying everything, however, is a strategy – since you cannot think that articles should just be written – so you need targeted planning that also sets traffic goals to be achieved. In short, you need a real “editorial plan“, which identifies the strategy to be pursued, sets the goals to be achieved, and identifies the target audience you are trying to intercept.

The editorial plan is the backbone of the site and is based on the essentials of the online presence, exactly because it is the set of strategic actions aimed at achieving a goal that includes directions on “what, when and how” to publish content online in a strategic way.

SEOZoom’s Editorial Plan is a comprehensive tool that allows you to refine and make your content creation and management work more effective, since it allows you to create effective and strategic editorial plans and get a complete picture of the state of the work, fixing the gap that often exists between publishers and copywriters.

If you log in from the suite (Editorial Tools -> Editorial Plan Management) you will be able to reach the platform dedicated to Editors, where you can totally control the content of your site, and in particular:

  • Set up your editorial calendar effectively.
  • Write new SEO-oriented articles.
  • Enhance all editorial content on the site.
  • Discover article performance.
  • Commission articles to be written by internal or external copywriters, either by selecting an external copywriter from the “Available Copywriters” list on SEOZoom or by inviting one of your own team members via email.
  • Monitor the results of copywriters connected to the project.

At a glance, the dashboard offers key information about your site’s editorial plan, such as number of total articles (assigned and completed), those accepted (i.e., already reviewed and meeting the set goals), those assigned to external copywriters but not yet delivered, those on deadline, and so on. SEOZoom allows you to keep track of the performance of all the articles and categories you have set up, to monitor the keyword and traffic performance of the various articles, but also the performance of each individual copy making up your editorial team, to find out who gets the most efficient results and who better meets Google’s appreciation.

When you create a new article or edit one already in the list, then, you can set the strategic aspects of the content, set the main and secondary keywords on which to focus the text and add any notes, useful if you are assigning the article to a copy. The main feature of the Editorial Plan, however, is the ability to get an SEO analysis, based on the keyword you have set as the main one, that informs you in real time of the level of optimization you are achieving with your content and title and meta description snippets: specifically, you can check whether your article is in focus with what users and Google expect on the topic (the Search Intent), and whether you are effectively using relevant topics and keywords. In addition, from here you can also optimize titles and meta descriptions, possibly peeking at those used by sites placed in TOP10 on Google to be inspired by wording already rewarded by the search engine.

Thanks to the SEO Analysis – divided, as in the other parts of the suite, into the tabs of Optimizations – Topics – Keywords – FAQ and Correlated – SEOZoom can help you directly in the writing phase to limit errors and maximize the effectiveness of the text, accompanying you in every moment of the creative process and providing you with the right tools for SEO writing specific for each site and need.

No less useful is the dashboard specifically made for copywriters, which can be accessed from https://sz2020.seozoom.it/copywriter/login  (registration is free) and that offers the same tools just described but designed and tailored to precisely meet the needs of copywriters, who can thus use the insights and tools to manage the tasks received.

Again, in fact, the added value is represented by the Real-Time SEO Analysis, which leads the copywriter in his/her writing activity with the help of numerical scores, indications and text messages on SEO optimizations that can direct the writing to maximize performance.

At any given time, the copy can easily check whether he or she is adhering to these guidelines, which derive from both Google’s best-practices and SEOZoom’s experience in this field, with so to speak “objective” (or at least standard) technical advice on title length, meta description, and content, and more purely practical cues such as headings, image, and keywords management.

With SEOZoom’s Editorial Assistant, we have virtually automated all of the analysis and review part of planning and writing, so that you can always work on articles that are perfectly focused on the topic exactly as it is pleasing Google and search engine users.

Question Explorer

Question Explorer is an innovative tool that allows you to find all the questions that users have in mind and search for on Google when they need to solve a real problem.

This new feature basically succeeds in searching for questions that are shown in Google SERPs and revealing all the keywords that Google’s algorithms consider relevant and useful to satisfy the user’s search need.

The interface of the feature traces that of Keyword Infinity: just enter words or entire sentences that make up the query you have in mind to analyze and launch the scan. To refine the search, then, you can also exclude certain terms, so you can limit the focus to the industry and niche type in which you operate and are interested.

On the next screen, SEOZoom then shows you the full list of keywords in which the query appears, i.e., the queries that trigger the “People also ask” box in Google’s SERP in which there is precisely (also) the relevant query, as well as a range of information about the entire group of keywords and individual keywords.

In particular, you can immediately see the total number of keywords related to the query, the overall volume of searches generated by these keywords, the average Keyword Difficulty, Keyword Opportunity and average CPC values, which help you get a first overview of the level of competition you can expect on the entire cluster.

Looking at the table, on the other hand, you can discover the detailed information about the individual keywords, with indications of precise search volume, level of seasonality, but also main type of intent and presence of any features in SERPs, so that you have all the information you need to write content aligned with the real needs of people and Google.

Tools

The Tools area of SEOZoom is your toolbox, where you can find what you need to optimize websites and strategies.

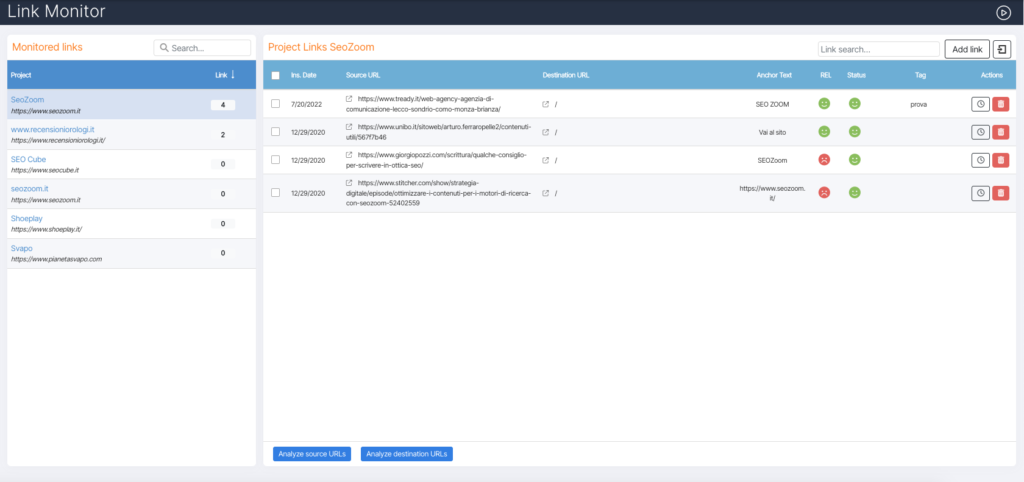
Available in the side menu, the section consists of as many as eight different tools – Analyze Domains List, Analyze Keywords List, Analyze URLs List, Analyze Ranking, Keyword grouper, Analyze Mixed Content, Link Monitor, and SERP Comparator – which we will now go into individually.

Analyze Ranking

The Analyze Ranking tool is very useful to check, quickly, the rankings of certain keywords for one or more domains. You can use it, for example, to quickly find out which page on your site ranks better for a set of keywords, or to do a simultaneous comparison between competitors, starting with a set of specific keywords.

To launch the scan you just have to follow the on-page instructions, and then enter on the left the domains you want to check and on the right the keywords: after a few seconds SEOZoom shows you all the information to find out where that domain ranks for that specified keyword, with an indication of the referring page.

Specifically, for each keyword occurrence the table provides data on the volume of the keyword, position on Google (with indication of the change from the previous SERP scan) and full URL positioned, repeating the same information for the other domains entered. At the end of the row you find the hamburger menu that leads you to the Keyword Actions with which to refine the analysis of the relevant keyword.

SERP Comparator

The last tool in this section is called the SERP Comparator and it helps you identify the underlying affinity level of the keywords and search intent being referenced.

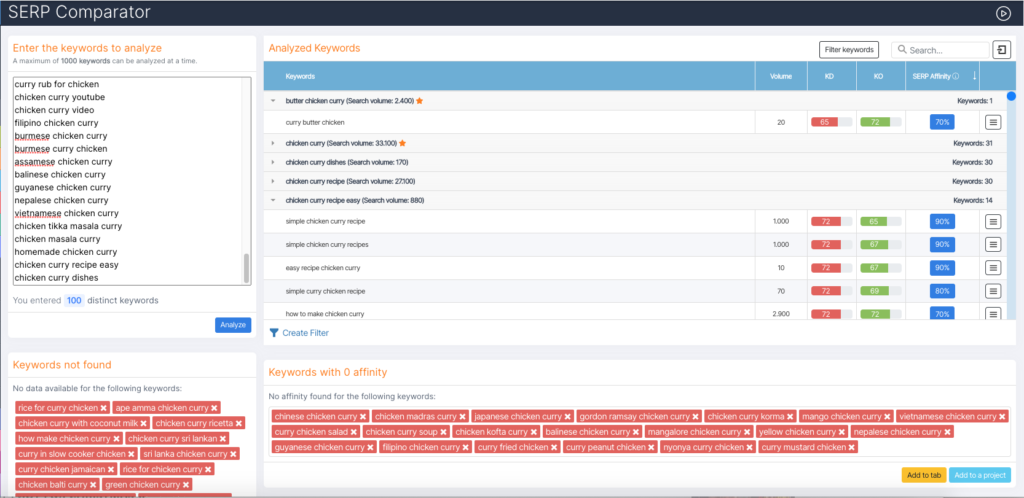
The tool allows you to quickly compare a list of up to 100 keywords: SEOZoom analyzes all the keywords and compares them one by one, indicating in the table on the right the level of affinity between the generated SERPs and thus simplifying your subsequent work of content production, also thanks to the possibility of refining the study of the proposed data thanks to the appropriate filters.

For each individual keyword analyzed, in fact, you can quickly read the average monthly search volume and, in the list below, the SERP Affinity value compared to each of the other keywords you have entered, of which you can also discover the Keyword Difficulty and Keyword Opportunity metrics (as well as perform Keyword Actions for more precise analysis). By clicking on the blue SA button, moreover, you can directly check the Google’s SERP for that keyword and thus find out which results actually appear on both pages and which, on the other hand, appear only in one circumstance.

For each cluster, then, you can also find out what the main keyword is, i.e., the main keyword that Google has identified as most relevant to the search intent of the query, which is flagged with a star.

The comparison is done on the basis of the SERP Affinity metric: in fact, SEOZoom does not show you keywords with SA values equal to 0, and therefore only compares keywords that generate SERPs in which there is at least one similar result.

Unlike the other tools in the suite, moreover, in this section the comparison is between all the keywords you have available, not just with the Main Keyword, and this can help you to set up another approach to keyword research.

Reports Area

In the Reports area of the side menu you can find features and tools that allow you to get overall overviews of the health of your site, which you can share with your team and clients or use to better analyze your project’s performance, critical issues, and potential areas for development.

Observatory

The Observatory is the section of the suite that provides you with two different tools that are updated practically in real time: SERP Observatory is a set of data on Google’s search results pages and current movements, while instead ZA Observatory is an ongoing focus on the distribution of all sites ranked according to Zoom Authority, our proprietary metric that objectively assesses the quality of a domain in Google’s eyes.

Let’s take a detailed look at the features of these two features.