Monitored Keywords
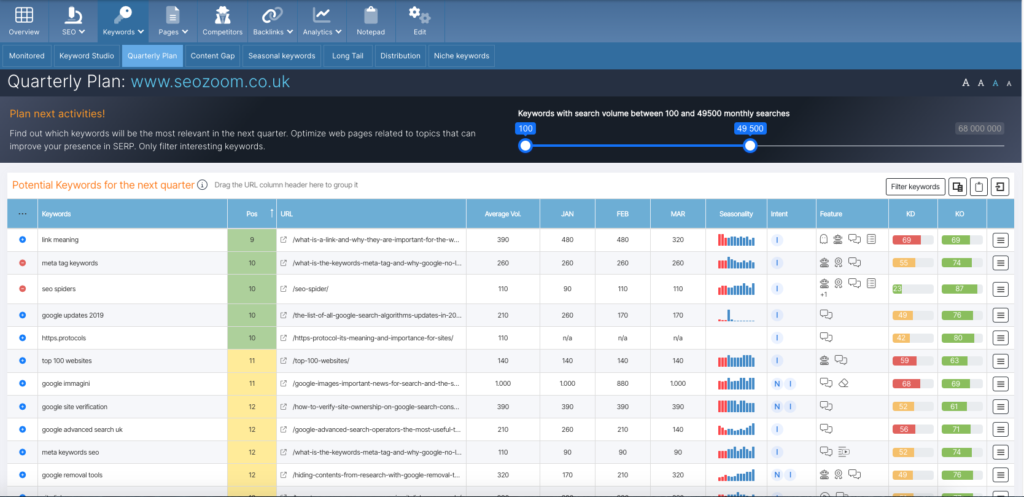
The first section of the menu allows you to delve into the performance of the monitored keywords, which are precisely those that you have decided to include in the list that SZ provides you to track performance more accurately.
In the left part of the screen you can consult the table with all the keywords you have added, for which the main information and values are shown (estimated search volume, position in SERP, variation from previous scan and SEO score from the last analysis), with the possibility of extending the analysis in detail by clicking on the hamburger menu (which opens the “keyword actions”).
At the top of the table, however, you will find buttons that allow you to copy the keywords to the clipboard, export all the data or expand the visualization, to discover more data and information. In doing so, in fact, you can also read the referring URL, recent ranking trend, average position (A.P., referring to the last two months), Google features that are activated and average CPC.
Even further up, then, there are three filters that help you refine your analysis: you can choose to filter keywords by their “behavior” in SERPs (position, trend etc.), by tag (if you obviously matched the keywords to a label when creating them) or by time interval. Small note: if you change the dates of the analysis, the Average Position value will also be recalculated accordingly.
On the right side you can check the performance of the individual keyword selected in SERP and all the main changes in organic ranking over time, with the possibility to set a custom date range as well. On the other hand, by clicking on the “SERP feature” TAB you can view the composition of Google’s SERP for that keyword, with a preview of the results placed in TOP10 with their snippets and a description of any additional features present, such as featured snippets.
Lastly, the last box on the right lists the sites positioned in the first 5 pages of Google for that keyword and reports the change in ranking since the previous scan; furthermore, clicking on a result automatically adds the page to the SERP Trend graph to allow you to make a visual comparison between the performance of the various sites.
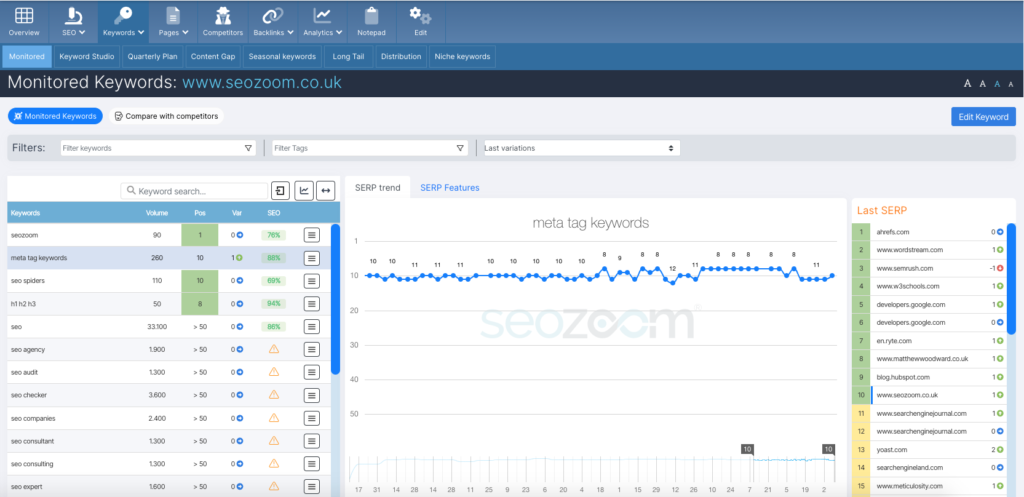
To refine your analysis, you can use the different filters available and then select specific groups of monitored keywords to study; in particular, you can filter keywords according to their performance, according to the tags you have set, or according to the latest time changes.
Then, by clicking on the “Compare with Competitors” tab, you can analyze the performance of the monitored keywords of your project site with the domains you have identified as organic competitors: for each keyword, SEOZoom shows you the search volume, the position of the project site and its URL, and, on the same line, information about the different competitor sites, to perform quick checks and strategic evaluations.